Rotating Propeller: Forward Flight
In this tutorial you simulate a spinning propeller in forward flight and read what it produces. You size the rotating zone, set the wind speed, angle of attack, and rotation speed, run the case, inspect the flow and the blade surfaces, and finish in the performance report.
This is the Forward flight condition of the Rotating Propeller card. Its guide card is titled Rotating Machinery. For still air, see Rotating Propeller: Static Thrust.
Duration: 20 min. Sample model: a prepared two-blade propeller, already imported.
How the tutorial works
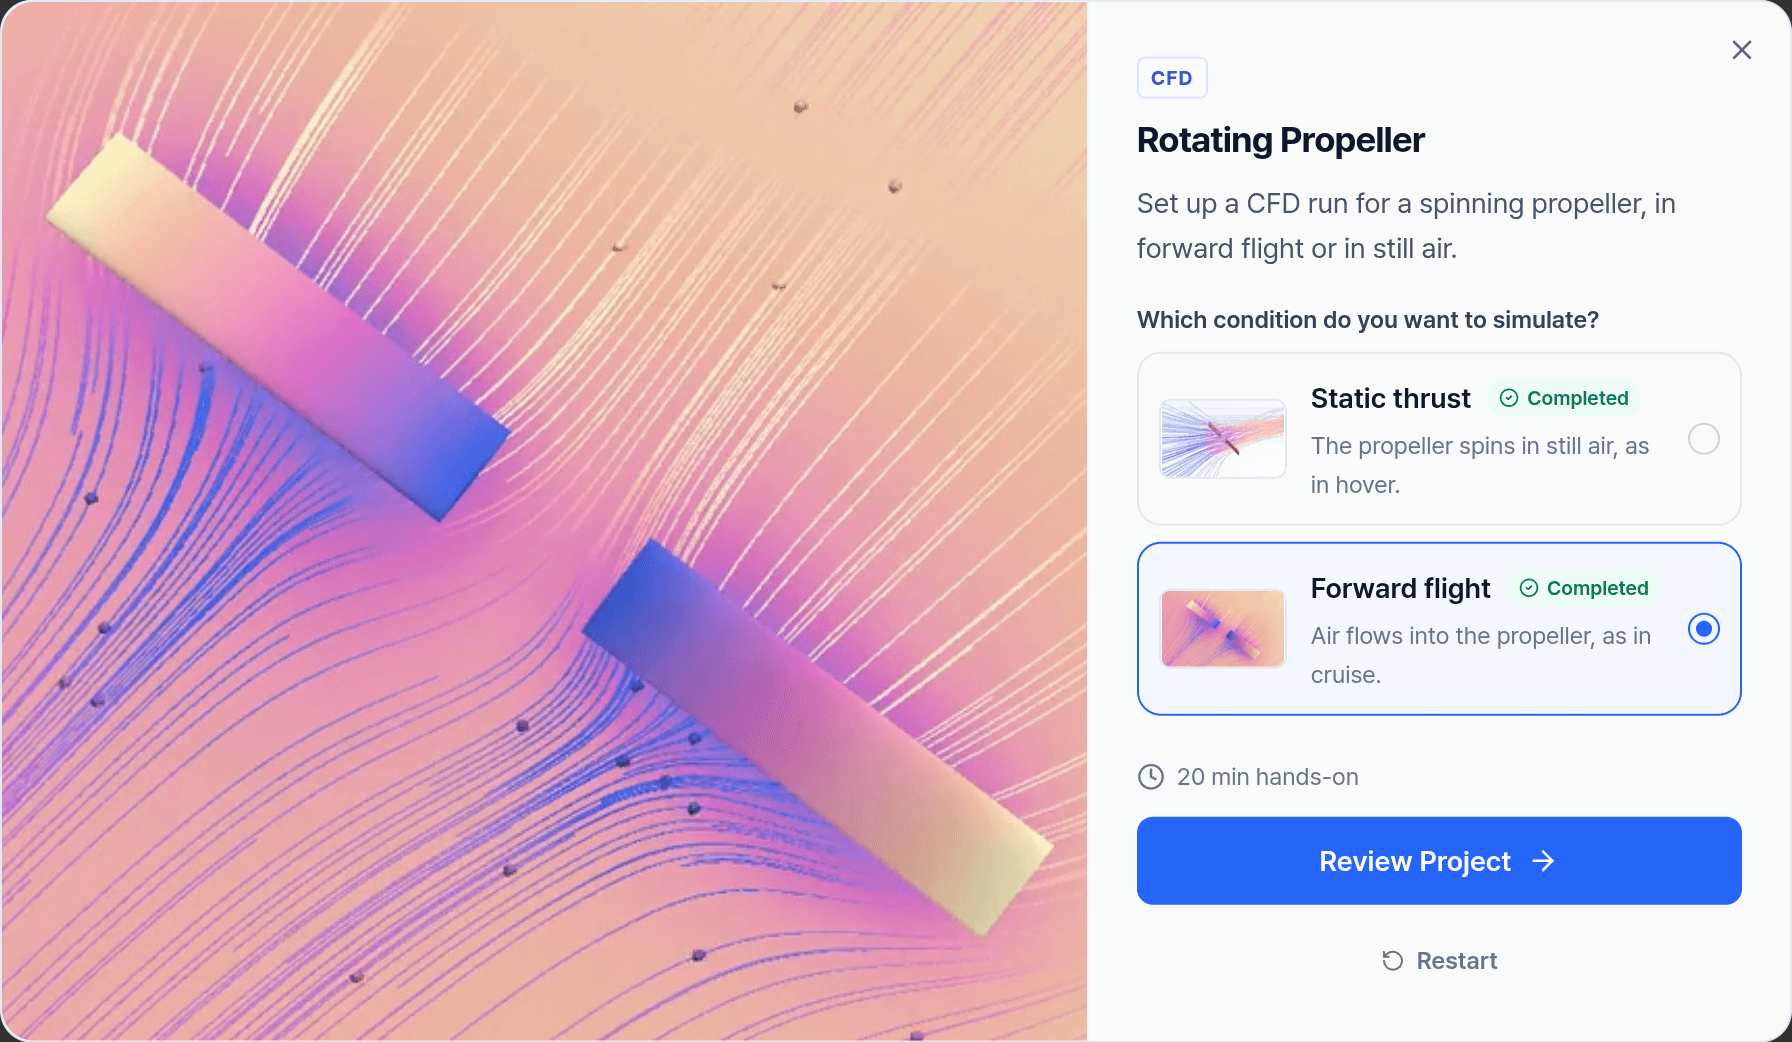
Open Tutorials in the dashboard, choose Rotating Propeller, and select Forward flight under Which condition do you want to simulate? A guide card walks you through the stages Geometry, Model, Physics, Solve, Results, and Report.
- A page's tasks tick themselves off when you do them. Next unlocks once all of them are done.
- Only the controls the current task needs respond to clicks.
- Click a task to see where it is on screen.
Run Simulation in a tutorial submits no job. After about 3 seconds it opens a result computed in advance. In your own projects, the solver creates the mesh and computes the flow, and the values change with geometry, RPM, wind speed, and mesh.
Geometry
Geometry Panel
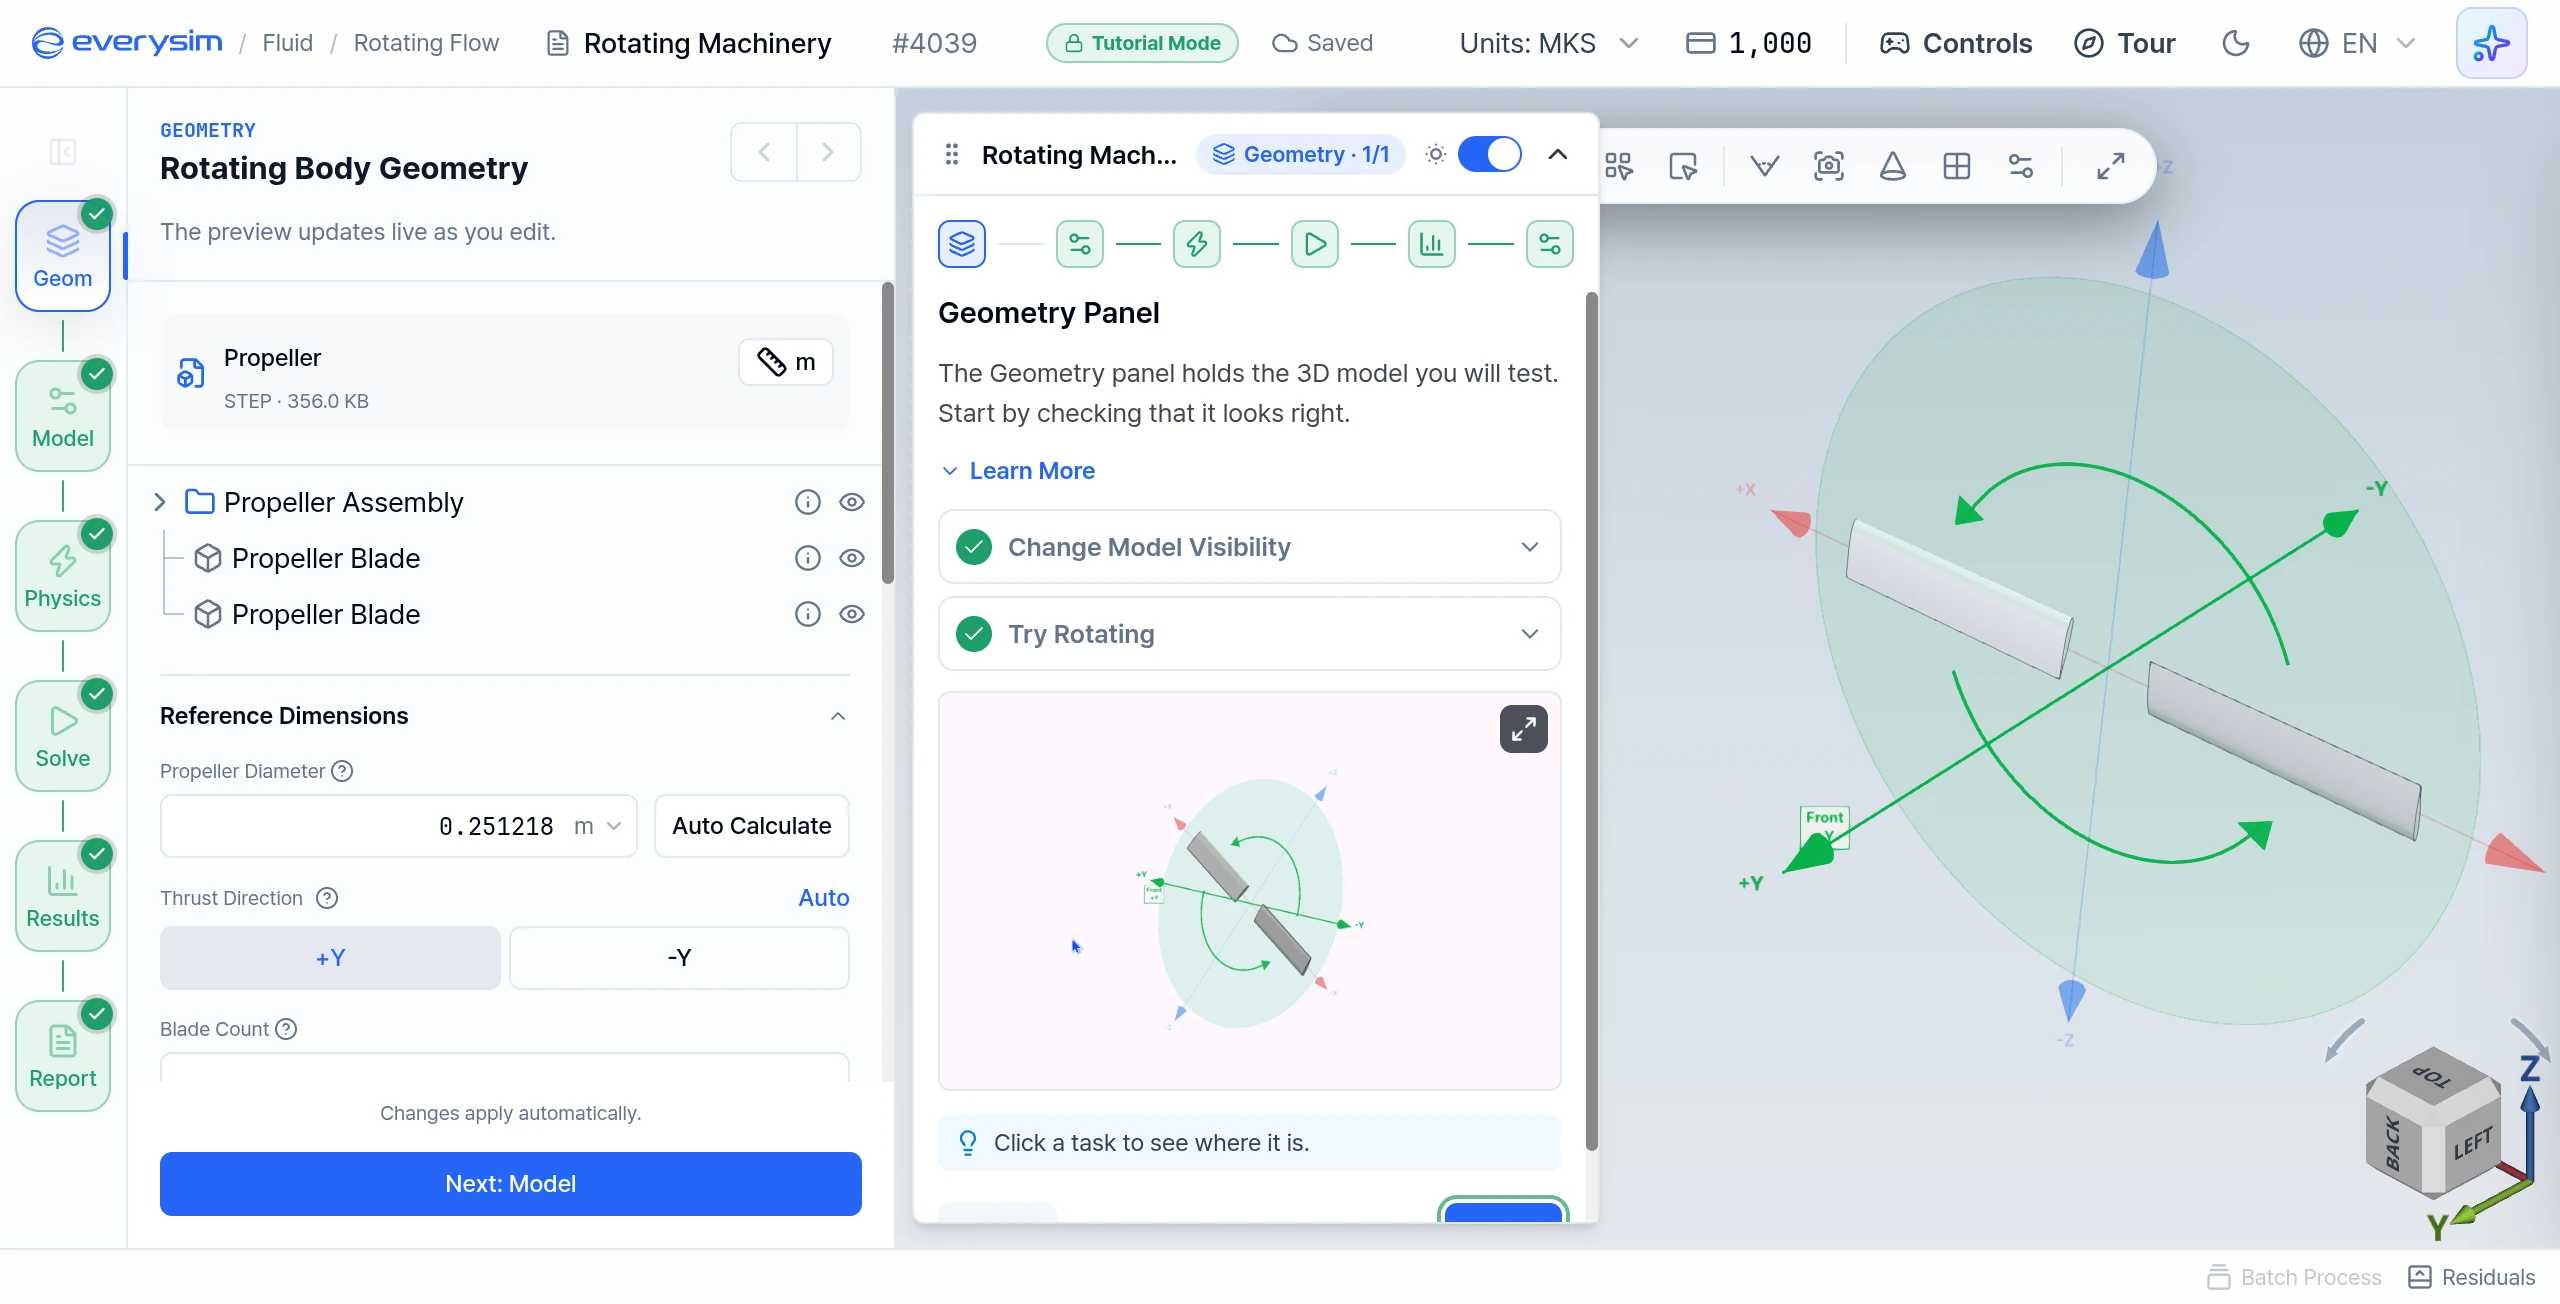
The Geometry panel holds the 3D model. Here you can look at its parts, show or hide them, and enter information about the geometry. The panel works out the thrust direction from the model, here +Y, and the rotation axis follows from it, so neither needs changing.
- Change Model Visibility: toggle the eye icon to hide the model, then show it again.
- Try Rotating: drag in the 3D viewport to rotate the model.
- Click Next in the guide card.
Model
Model Panel
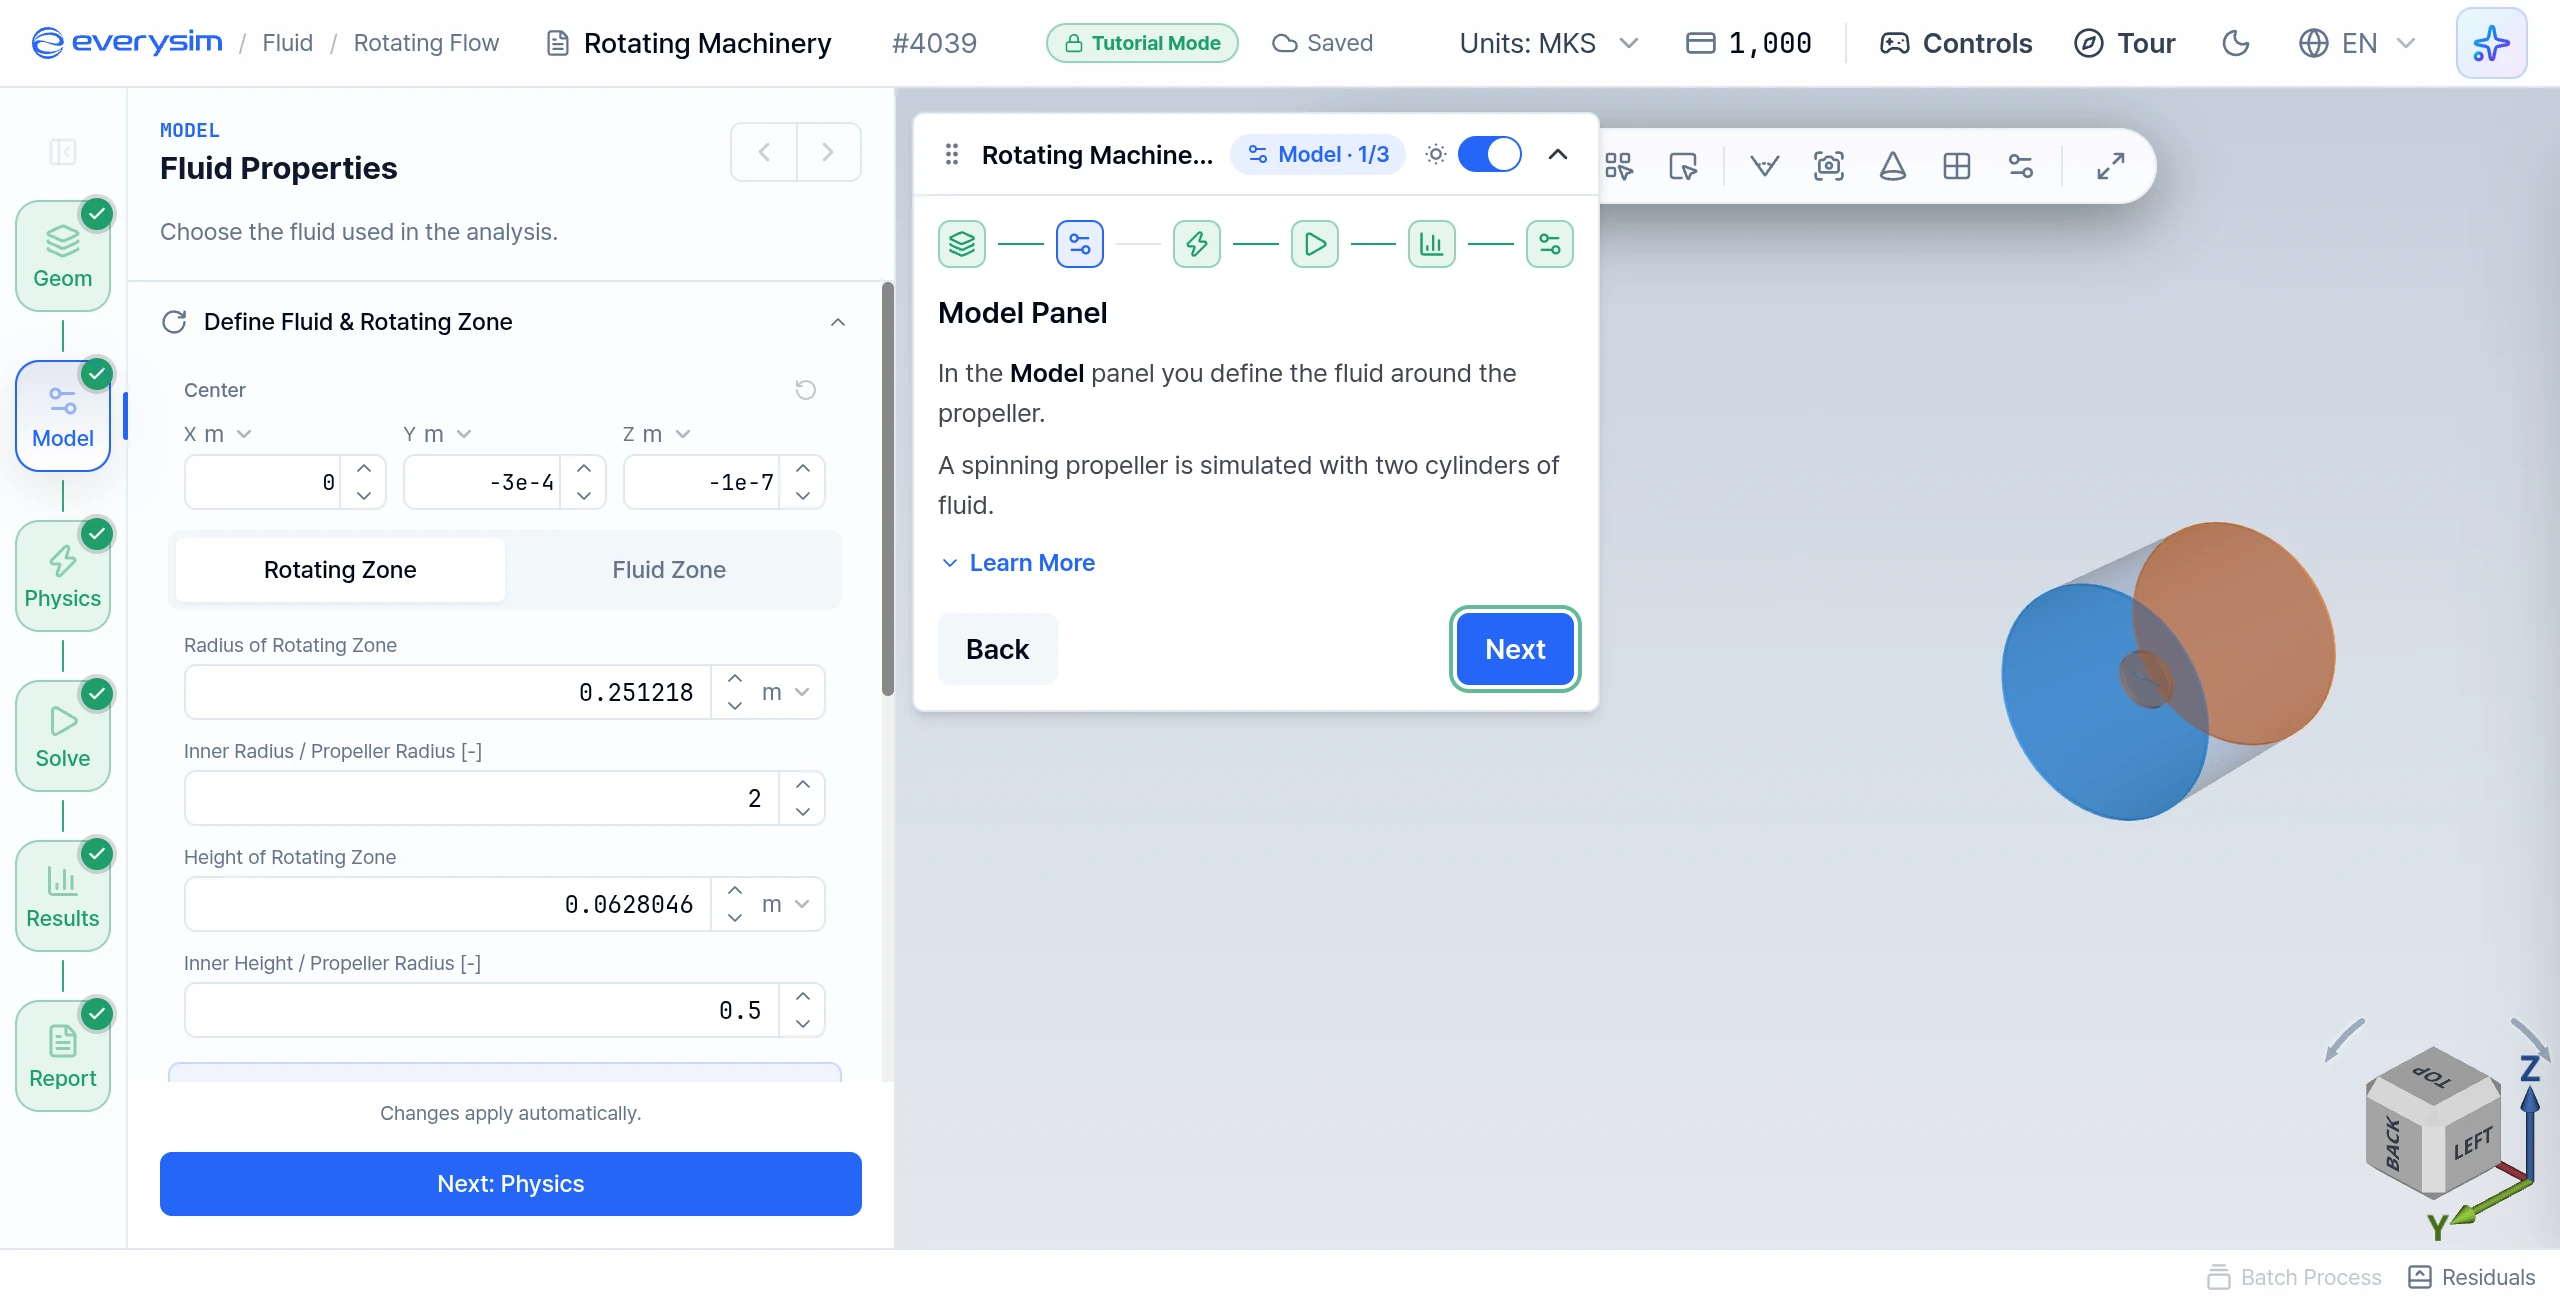
A spinning propeller is simulated with two cylinders of fluid. This page has nothing to set: look over Define Fluid & Rotating Zone and click Next.
- Rotating zone: a small cylinder around the blades. The fluid inside it rotates together with the propeller.
- Fluid zone: a much larger cylinder around everything. It gives the air room to flow in and the wake room to develop.
The zone Center stays as calculated from the geometry.
Rotating Zone Size
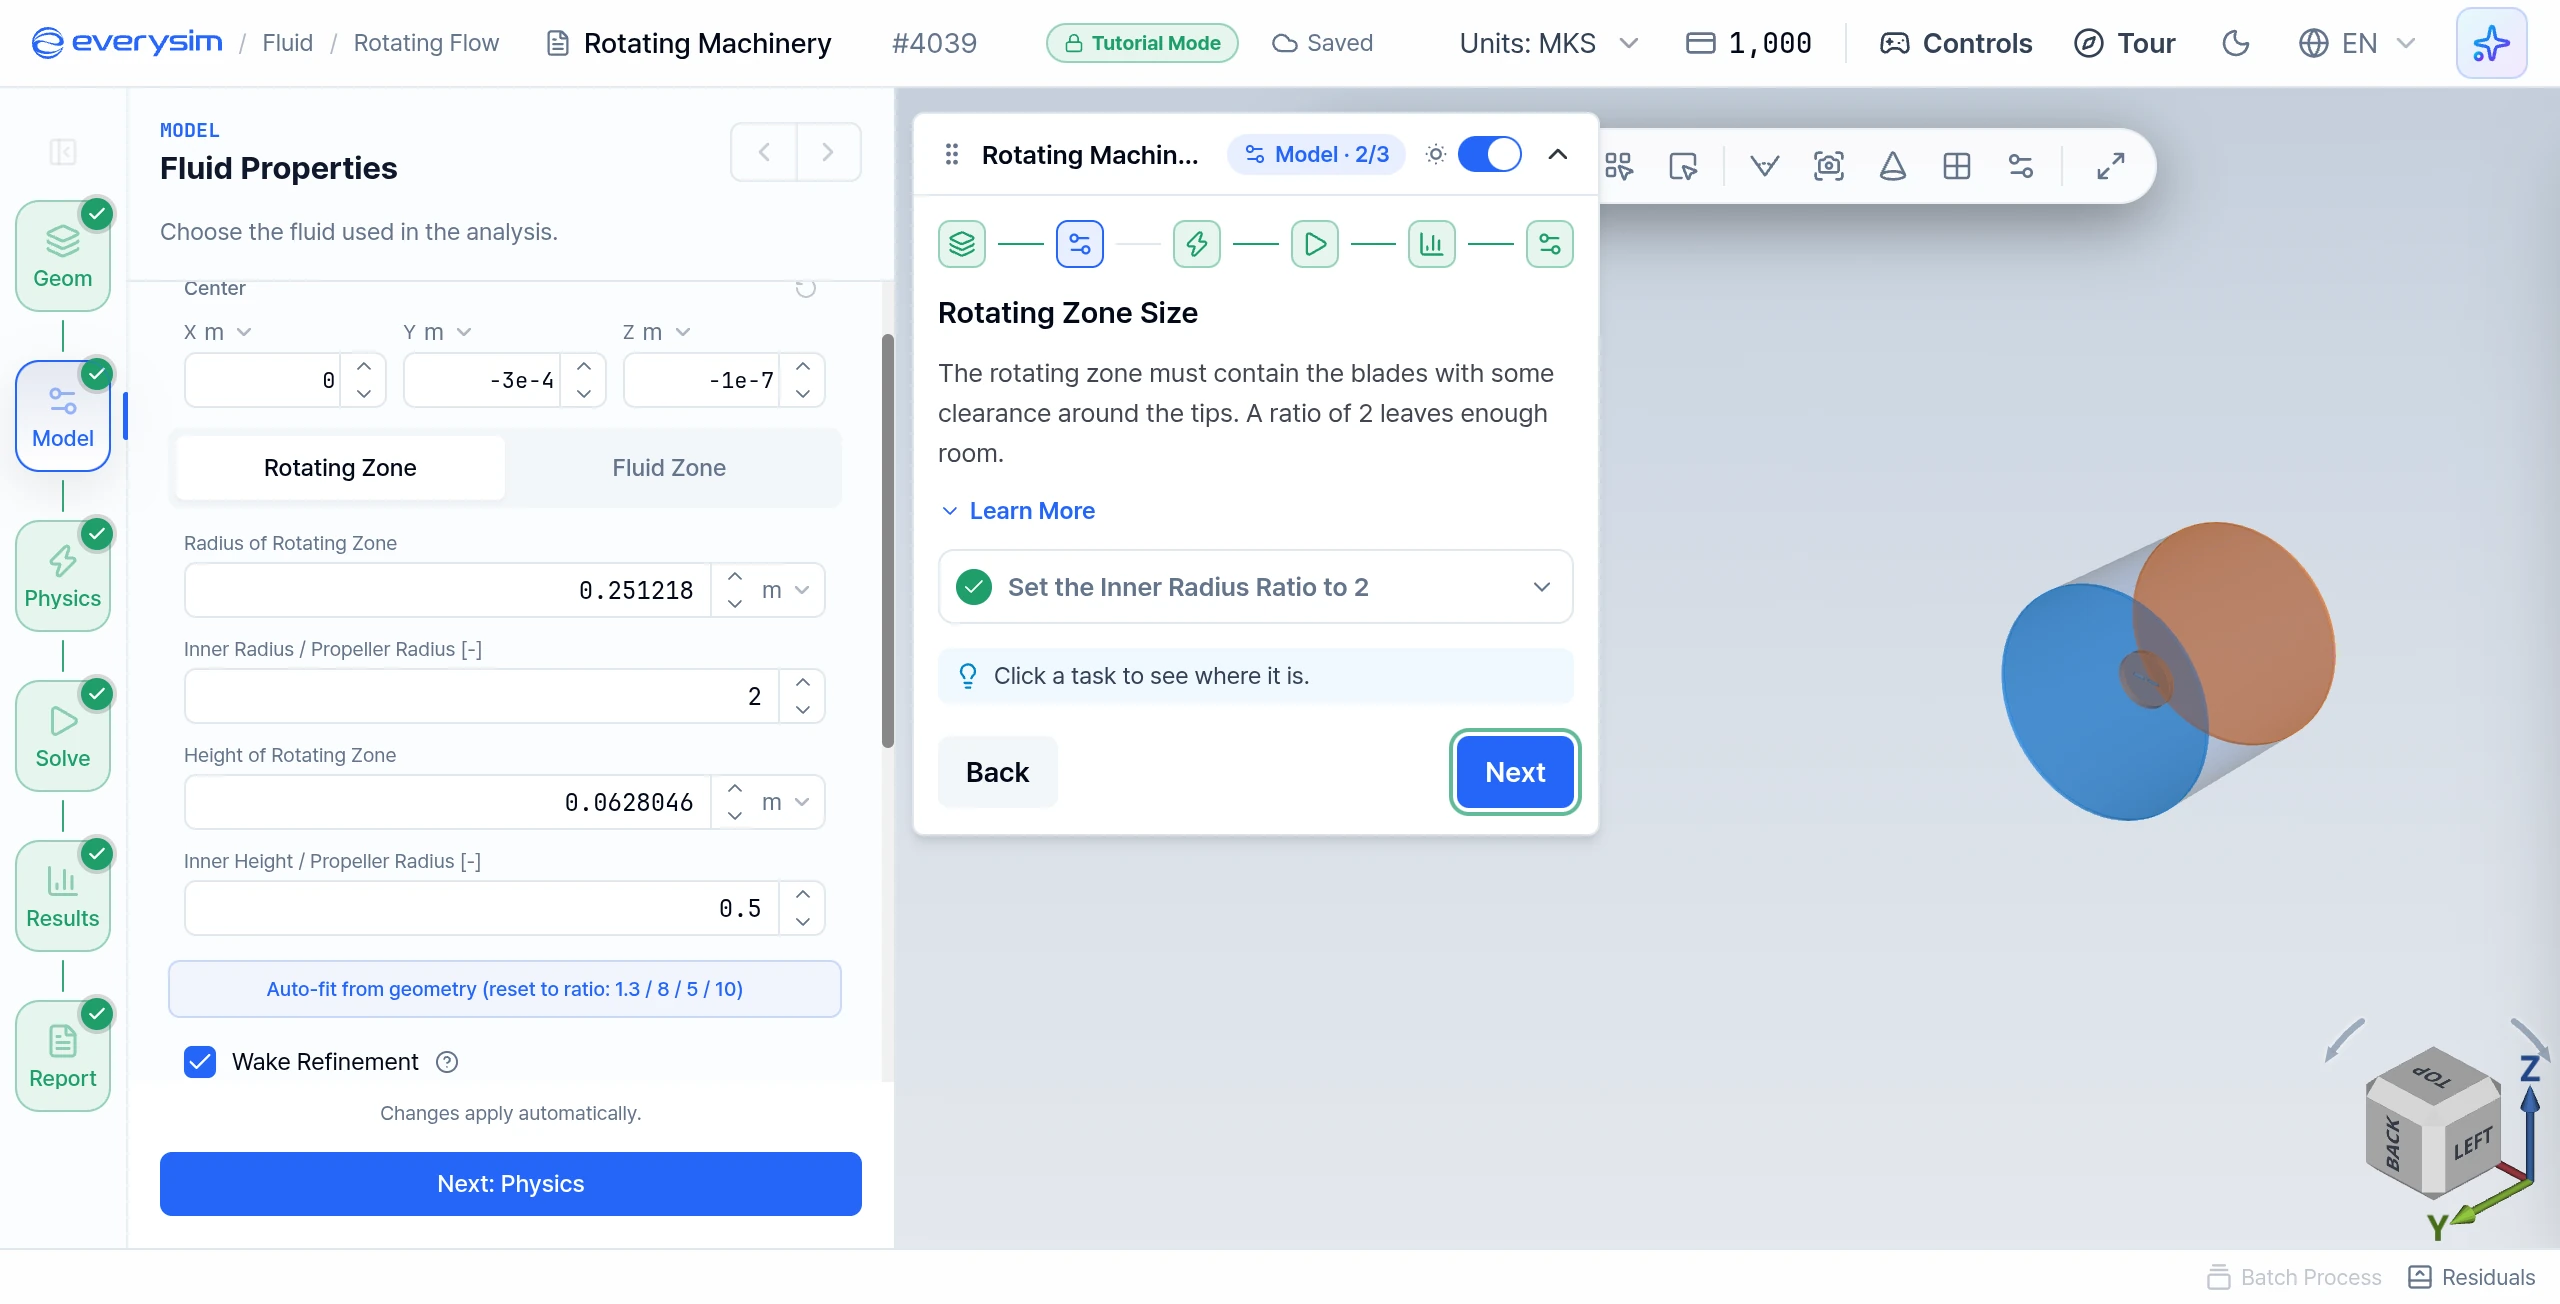
The rotating zone must contain the blades with some clearance around the tips. Zone sizes are ratios of the propeller radius, so they follow the size of your propeller.
- Set the Inner Radius Ratio to 2: under Inner Radius / Propeller Radius, type
2and press Enter (the default is1.3). Watch the inner cylinder grow in the viewport. - Inner Height / Propeller Radius stays at
0.5. - Click Next.
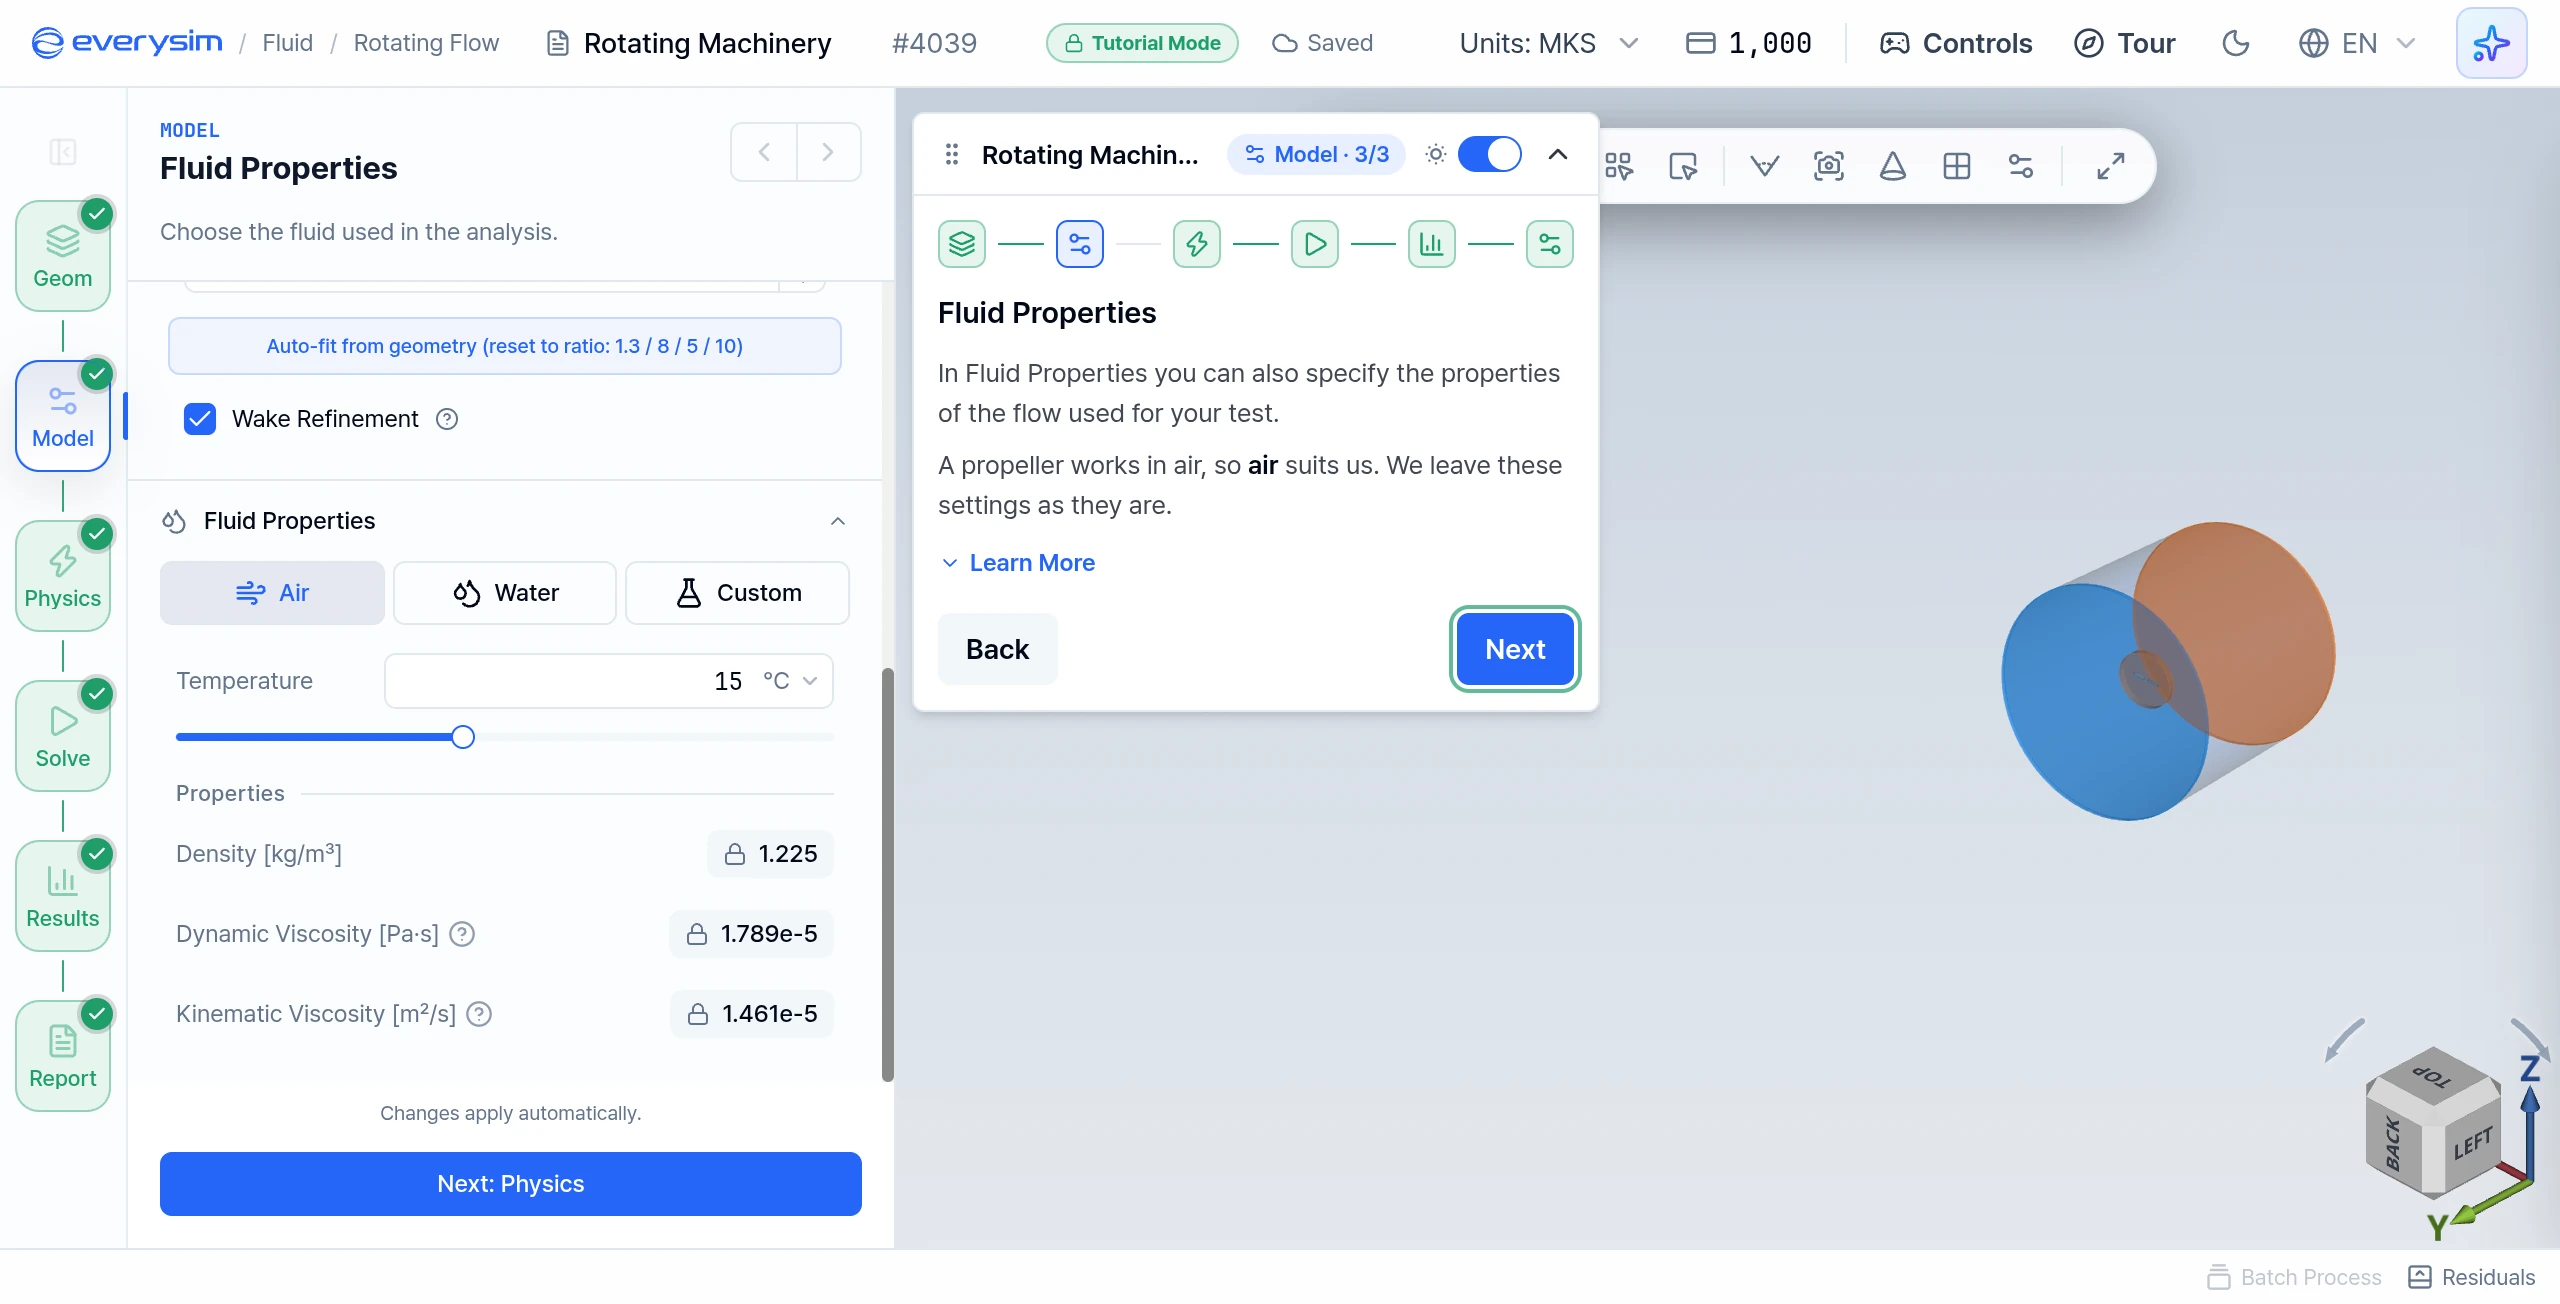
Fluid Properties
A propeller works in air, so Air stays selected. Look over the values and click Next. In your own project you can switch to the fluid you need, such as Water.
Physics
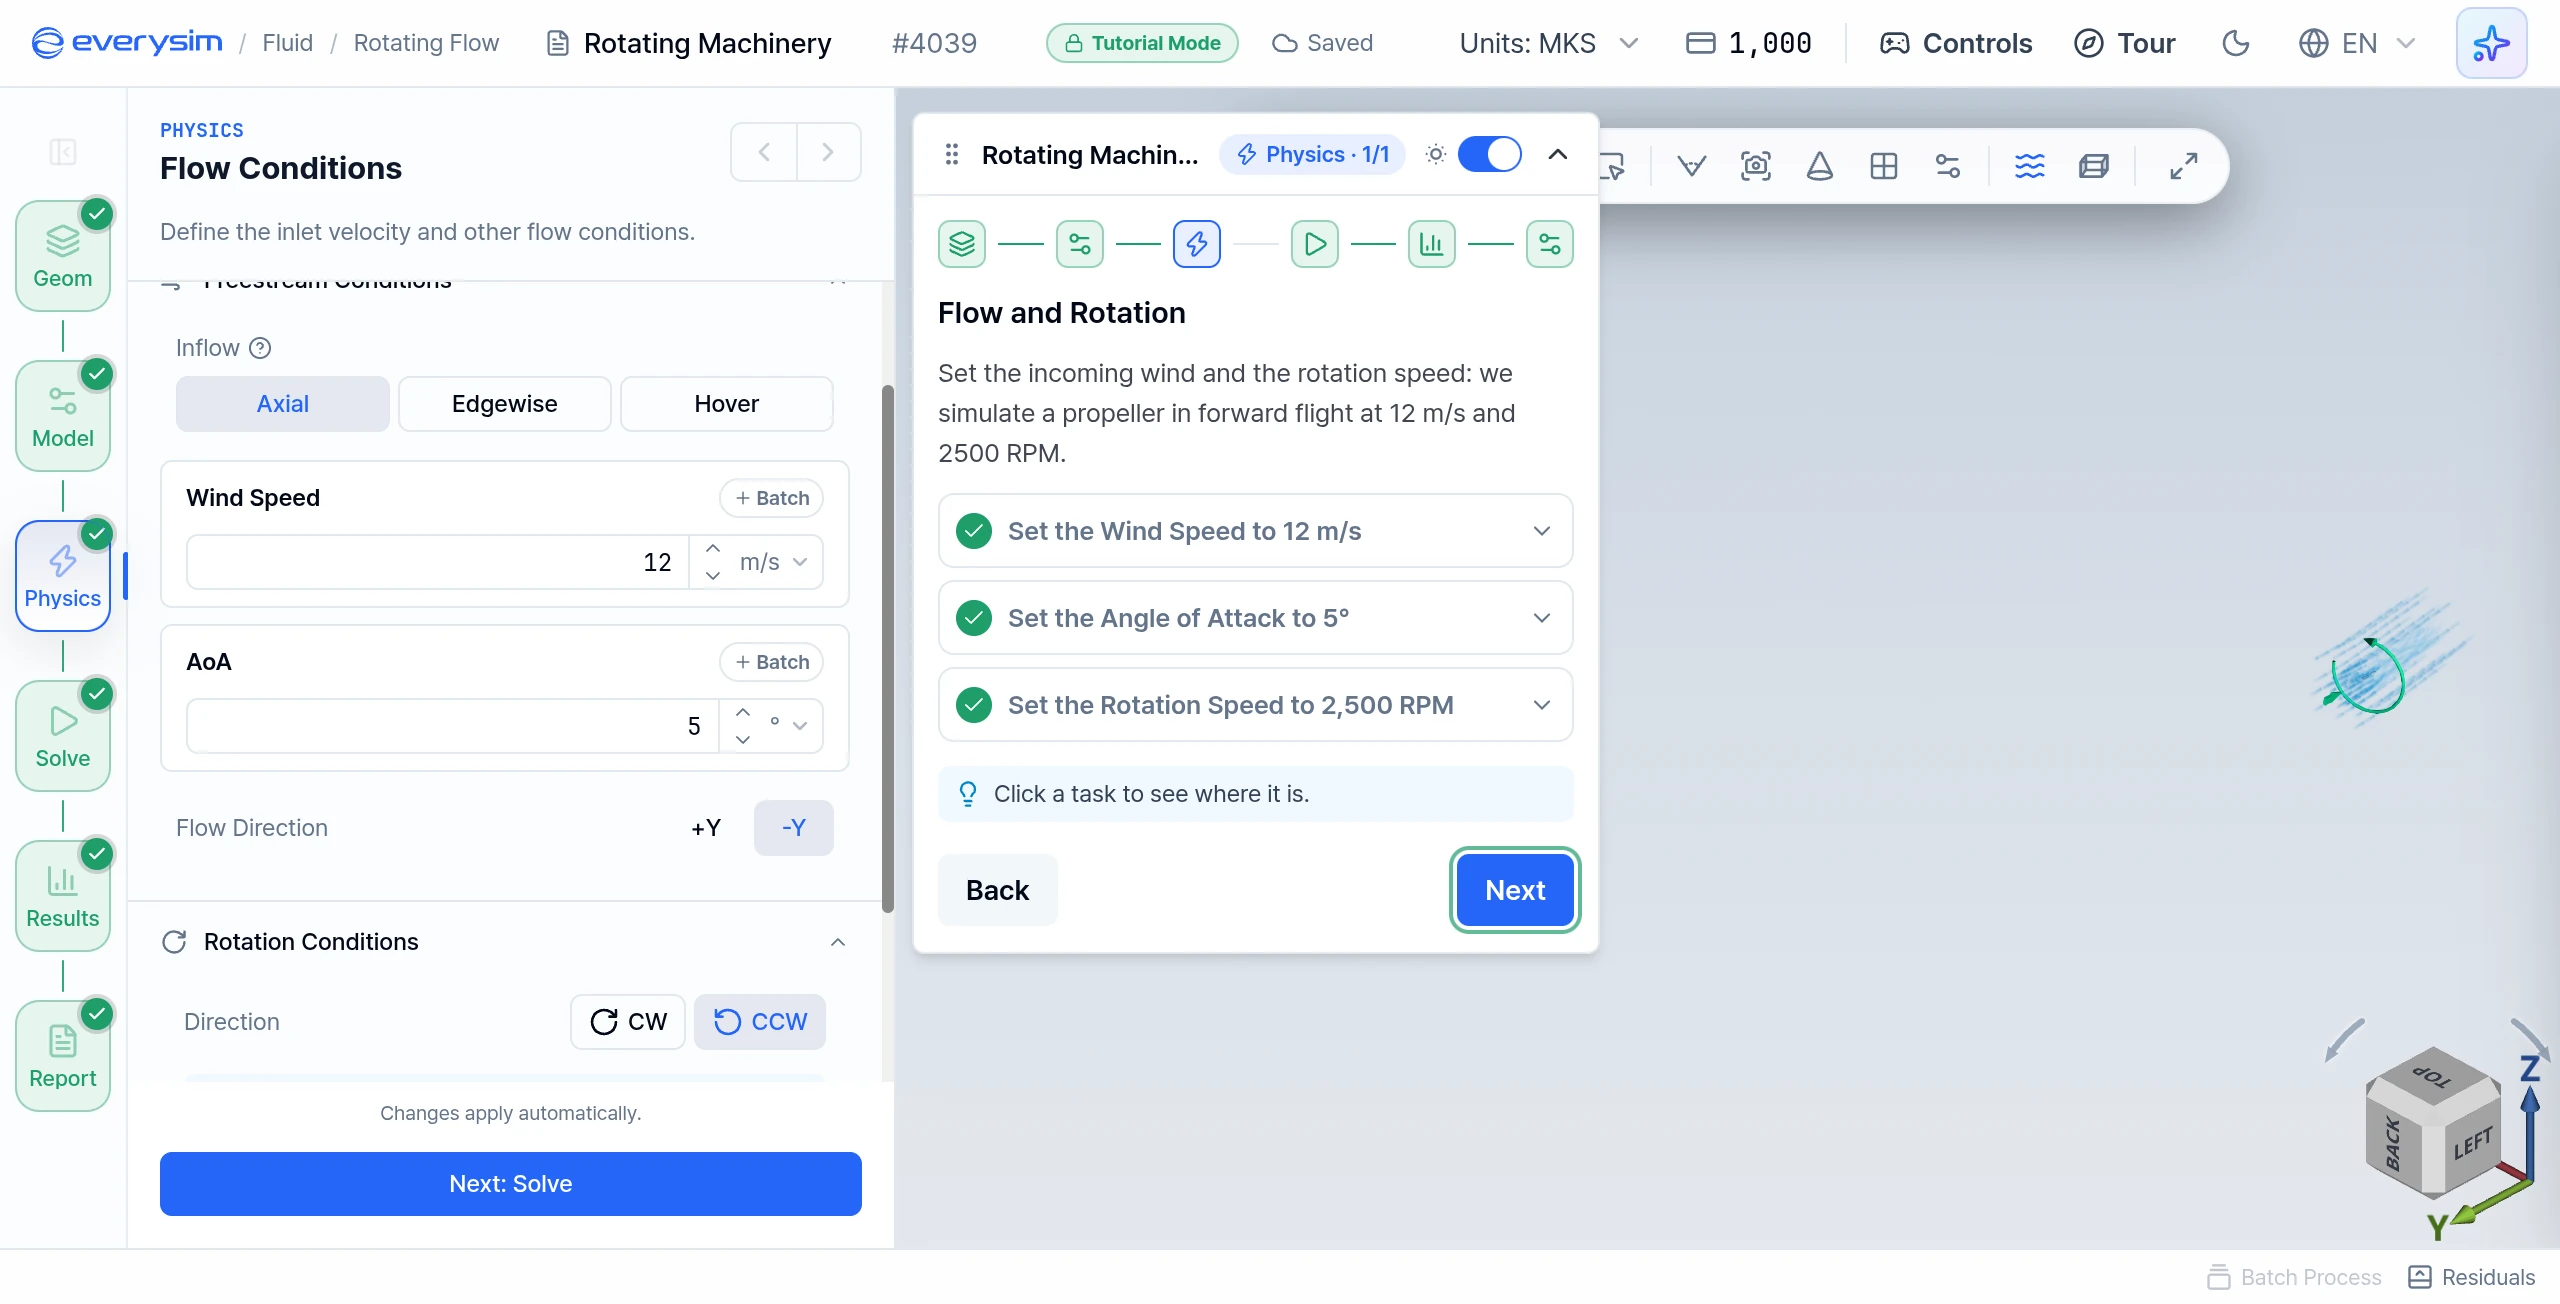
Flow and Rotation
Set the incoming wind and the rotation speed for a propeller in forward flight.
- Set the Wind Speed to 12 m/s: wind speed is the forward flight speed of the propeller. In Wind Speed, type
12and press Enter. - Set the Angle of Attack to 5°: the air arrives slightly at an angle, as in forward flight. In AoA, type
5and press Enter. - Set the Rotation Speed to 2,500 RPM: in Rotation Speed, type
2500and press Enter. Keep the unit on rpm. - Leave Inflow on Axial and Direction on CCW.
- Click Next.
Solve
Solve Panel · Accuracy
Accuracy controls how finely the mesh divides the space into cells. Higher levels take more time and credits. Mesh Settings stays on Auto · accuracy-based.
- Set Accuracy to 3: move the Accuracy slider to
3, a good balance of precision and cost for this case. - Click Next.

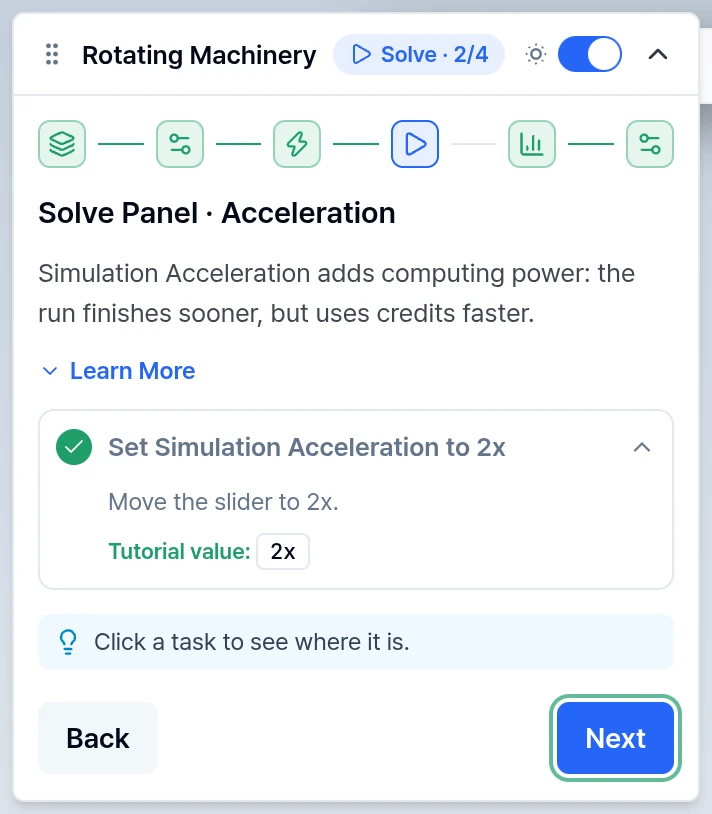
Solve Panel · Acceleration
Simulation Acceleration adds computing power. The run finishes sooner but uses credits faster. It changes only the speed, not the quality of the results.
- Set Simulation Acceleration to 2x: move the slider to
2x. - Click Next.
Run Simulation
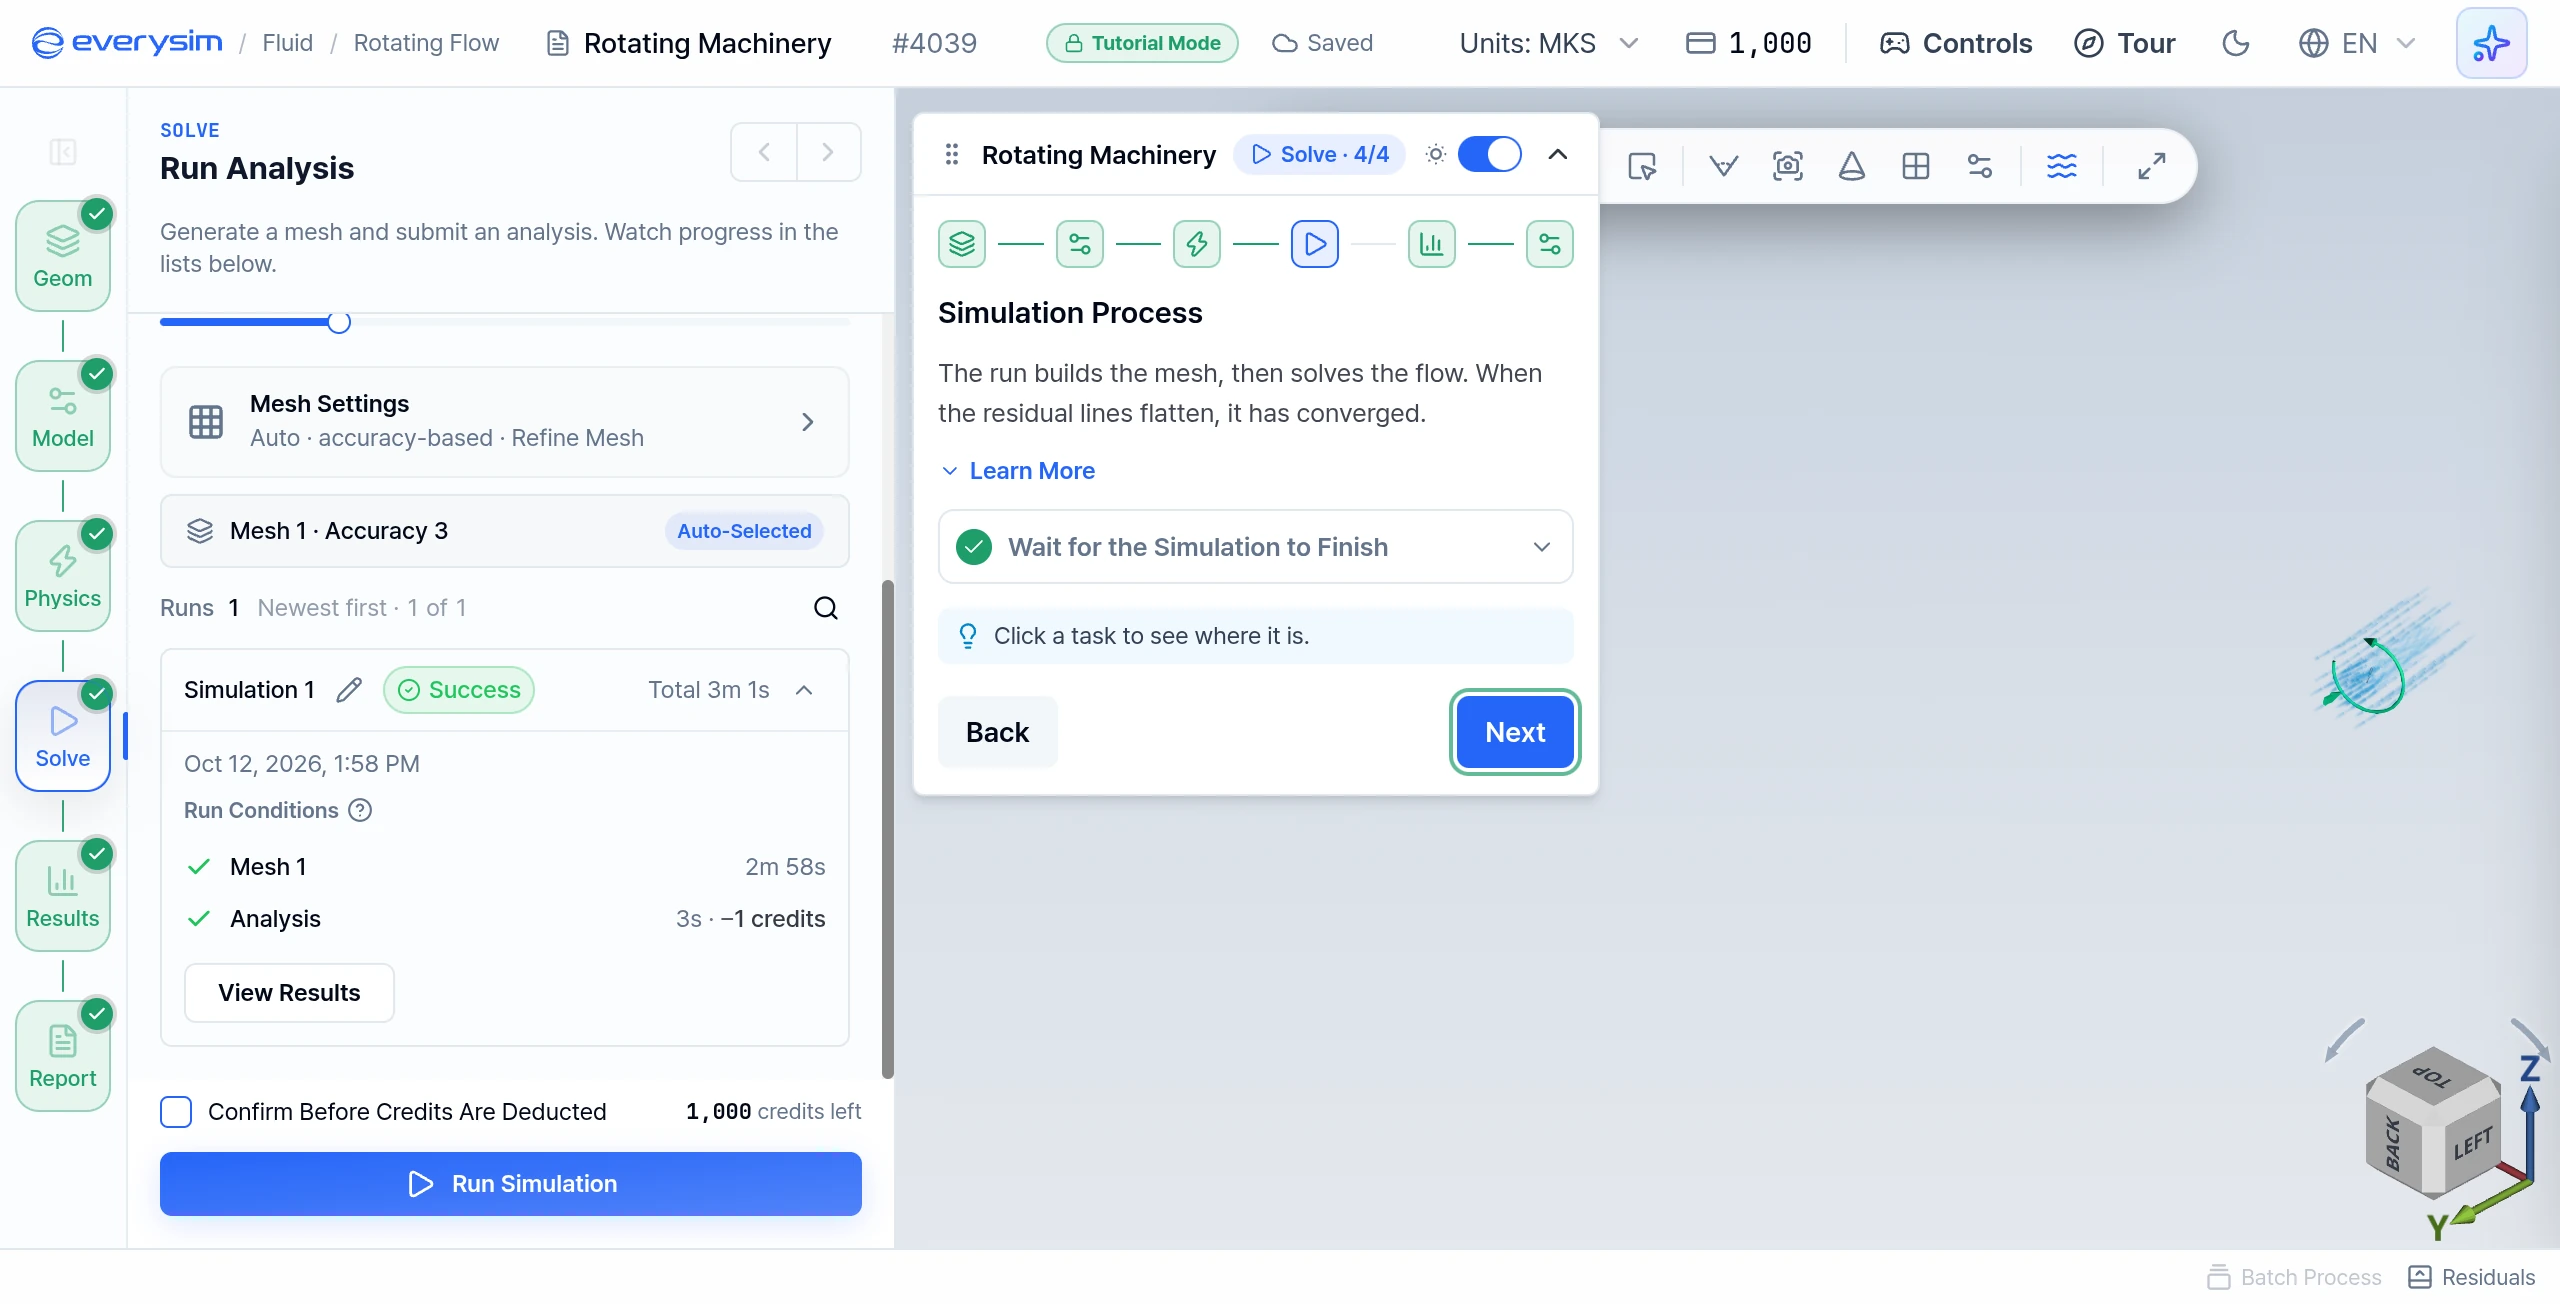
Click Run Simulation at the bottom of the Solve panel. If geometry data is still being prepared, wait for the button to become available.
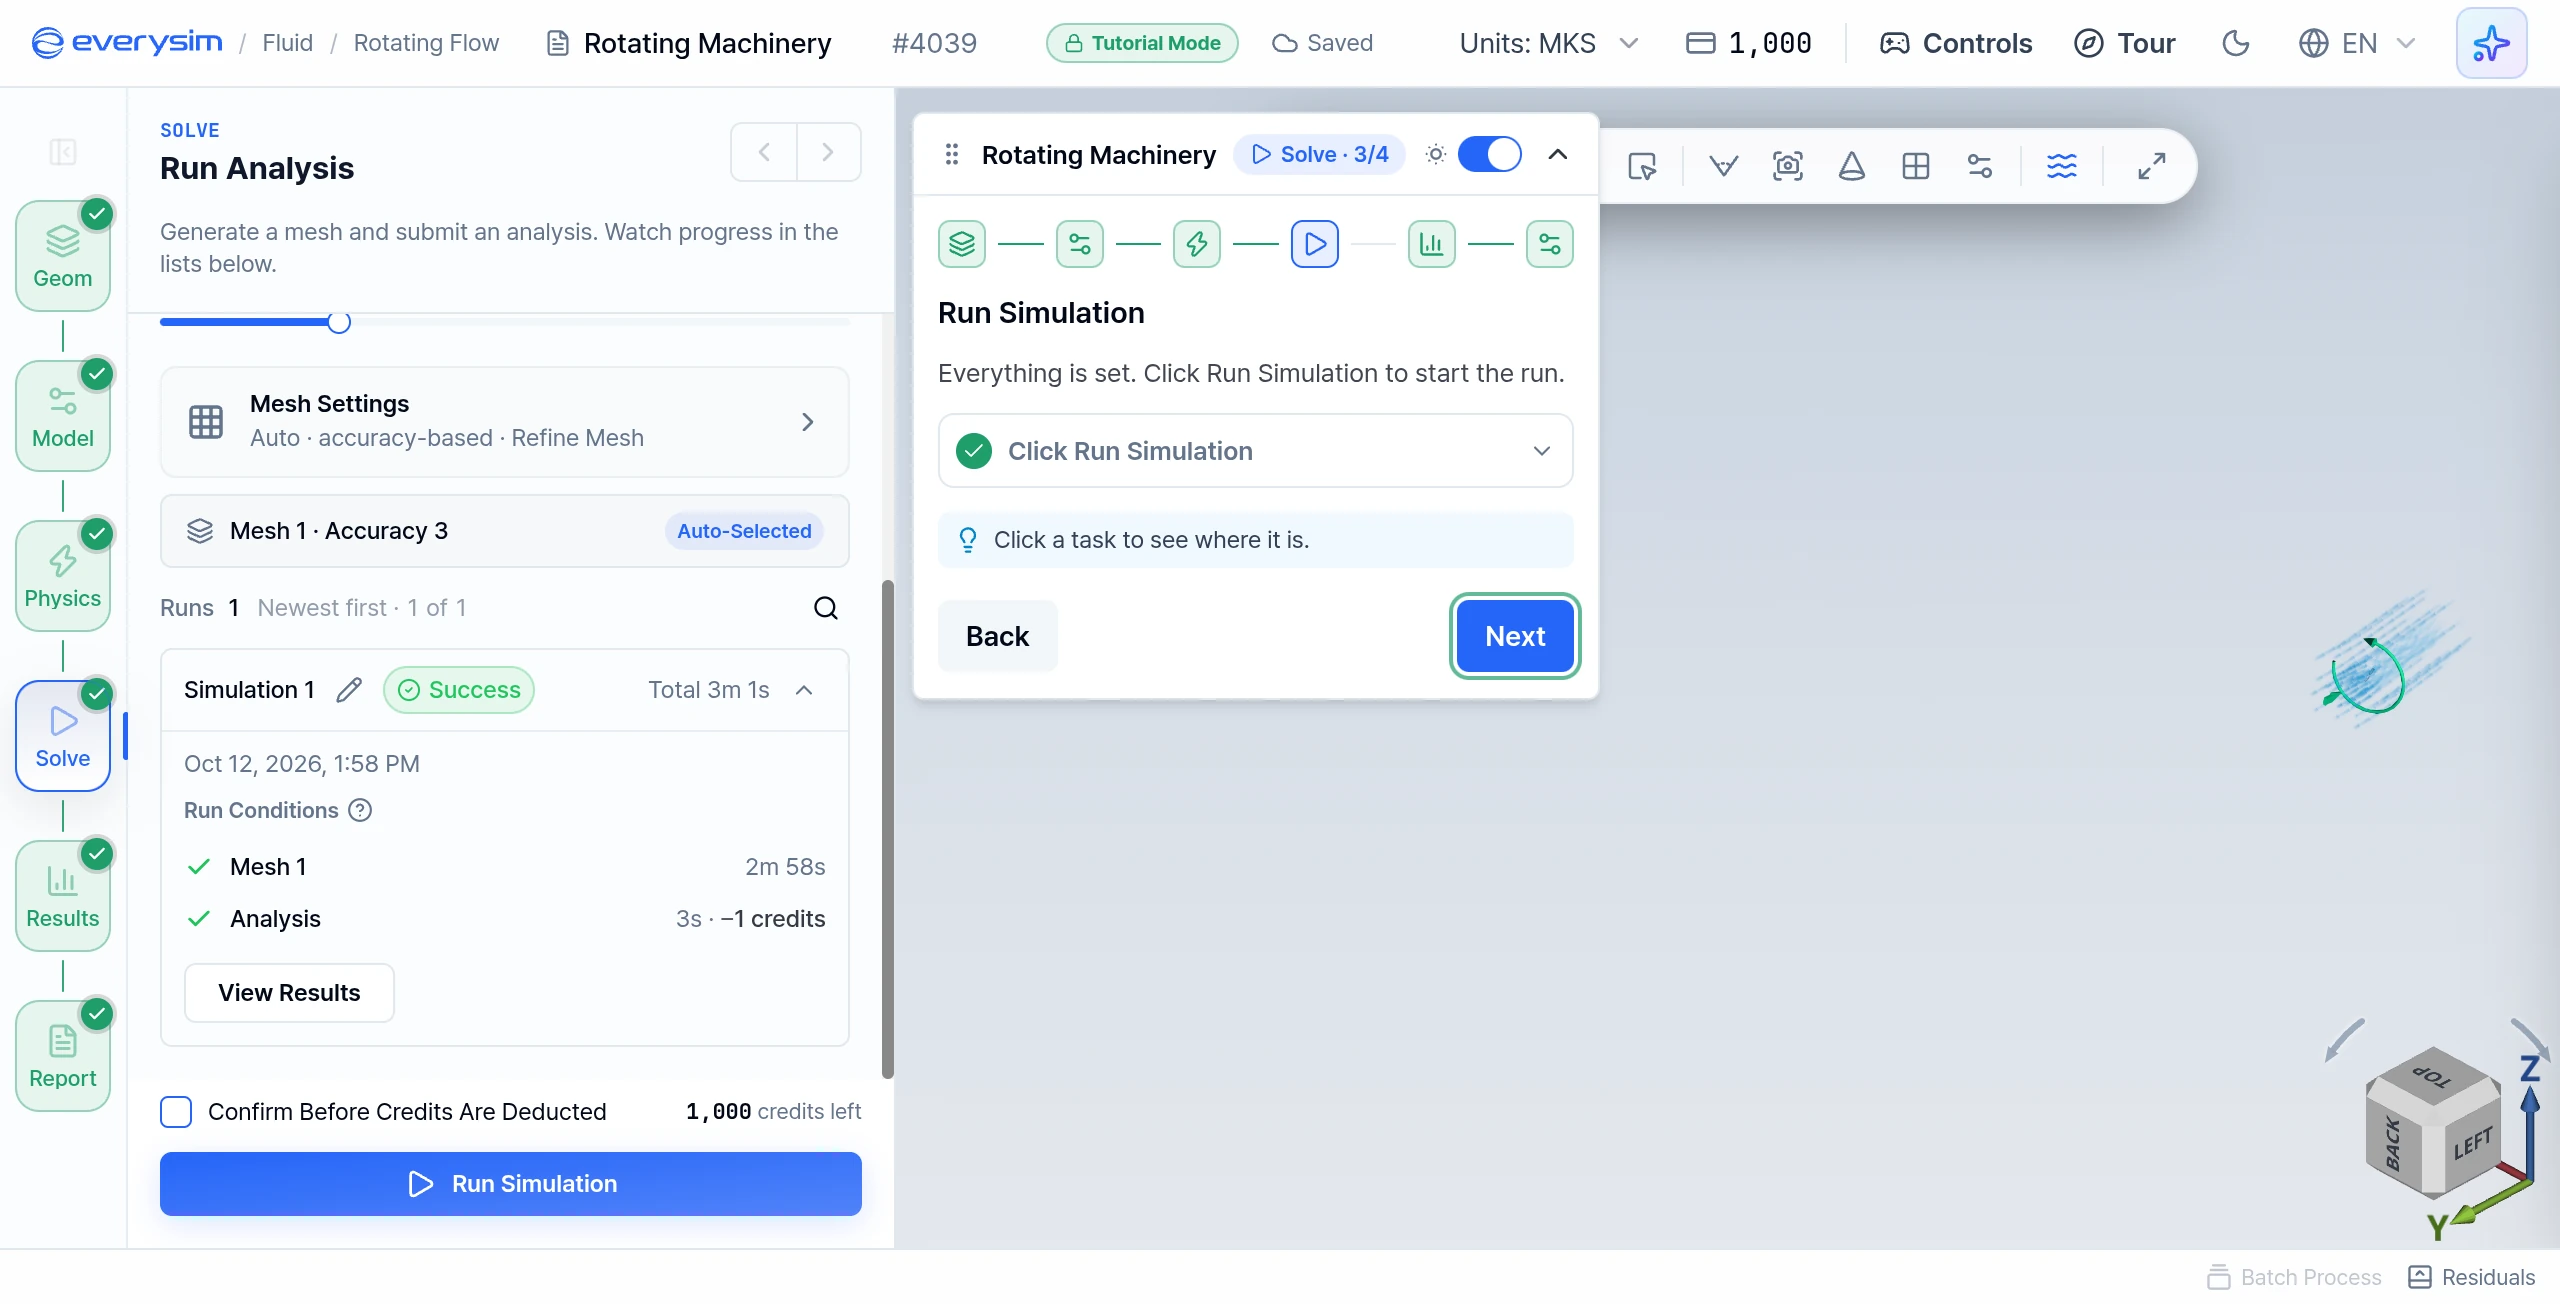
Simulation Process
Wait for the Simulation to Finish. In a tutorial this takes about 3 seconds, and then the prepared result opens by itself.
In your own projects the run has two phases. Mesh splits the simulation space into small cells, and Analysis calculates the flow on them. Click Residuals in the status bar to open the chart: residuals are the calculation error still left, and when the lines go down and flatten, the solution has converged.
Results
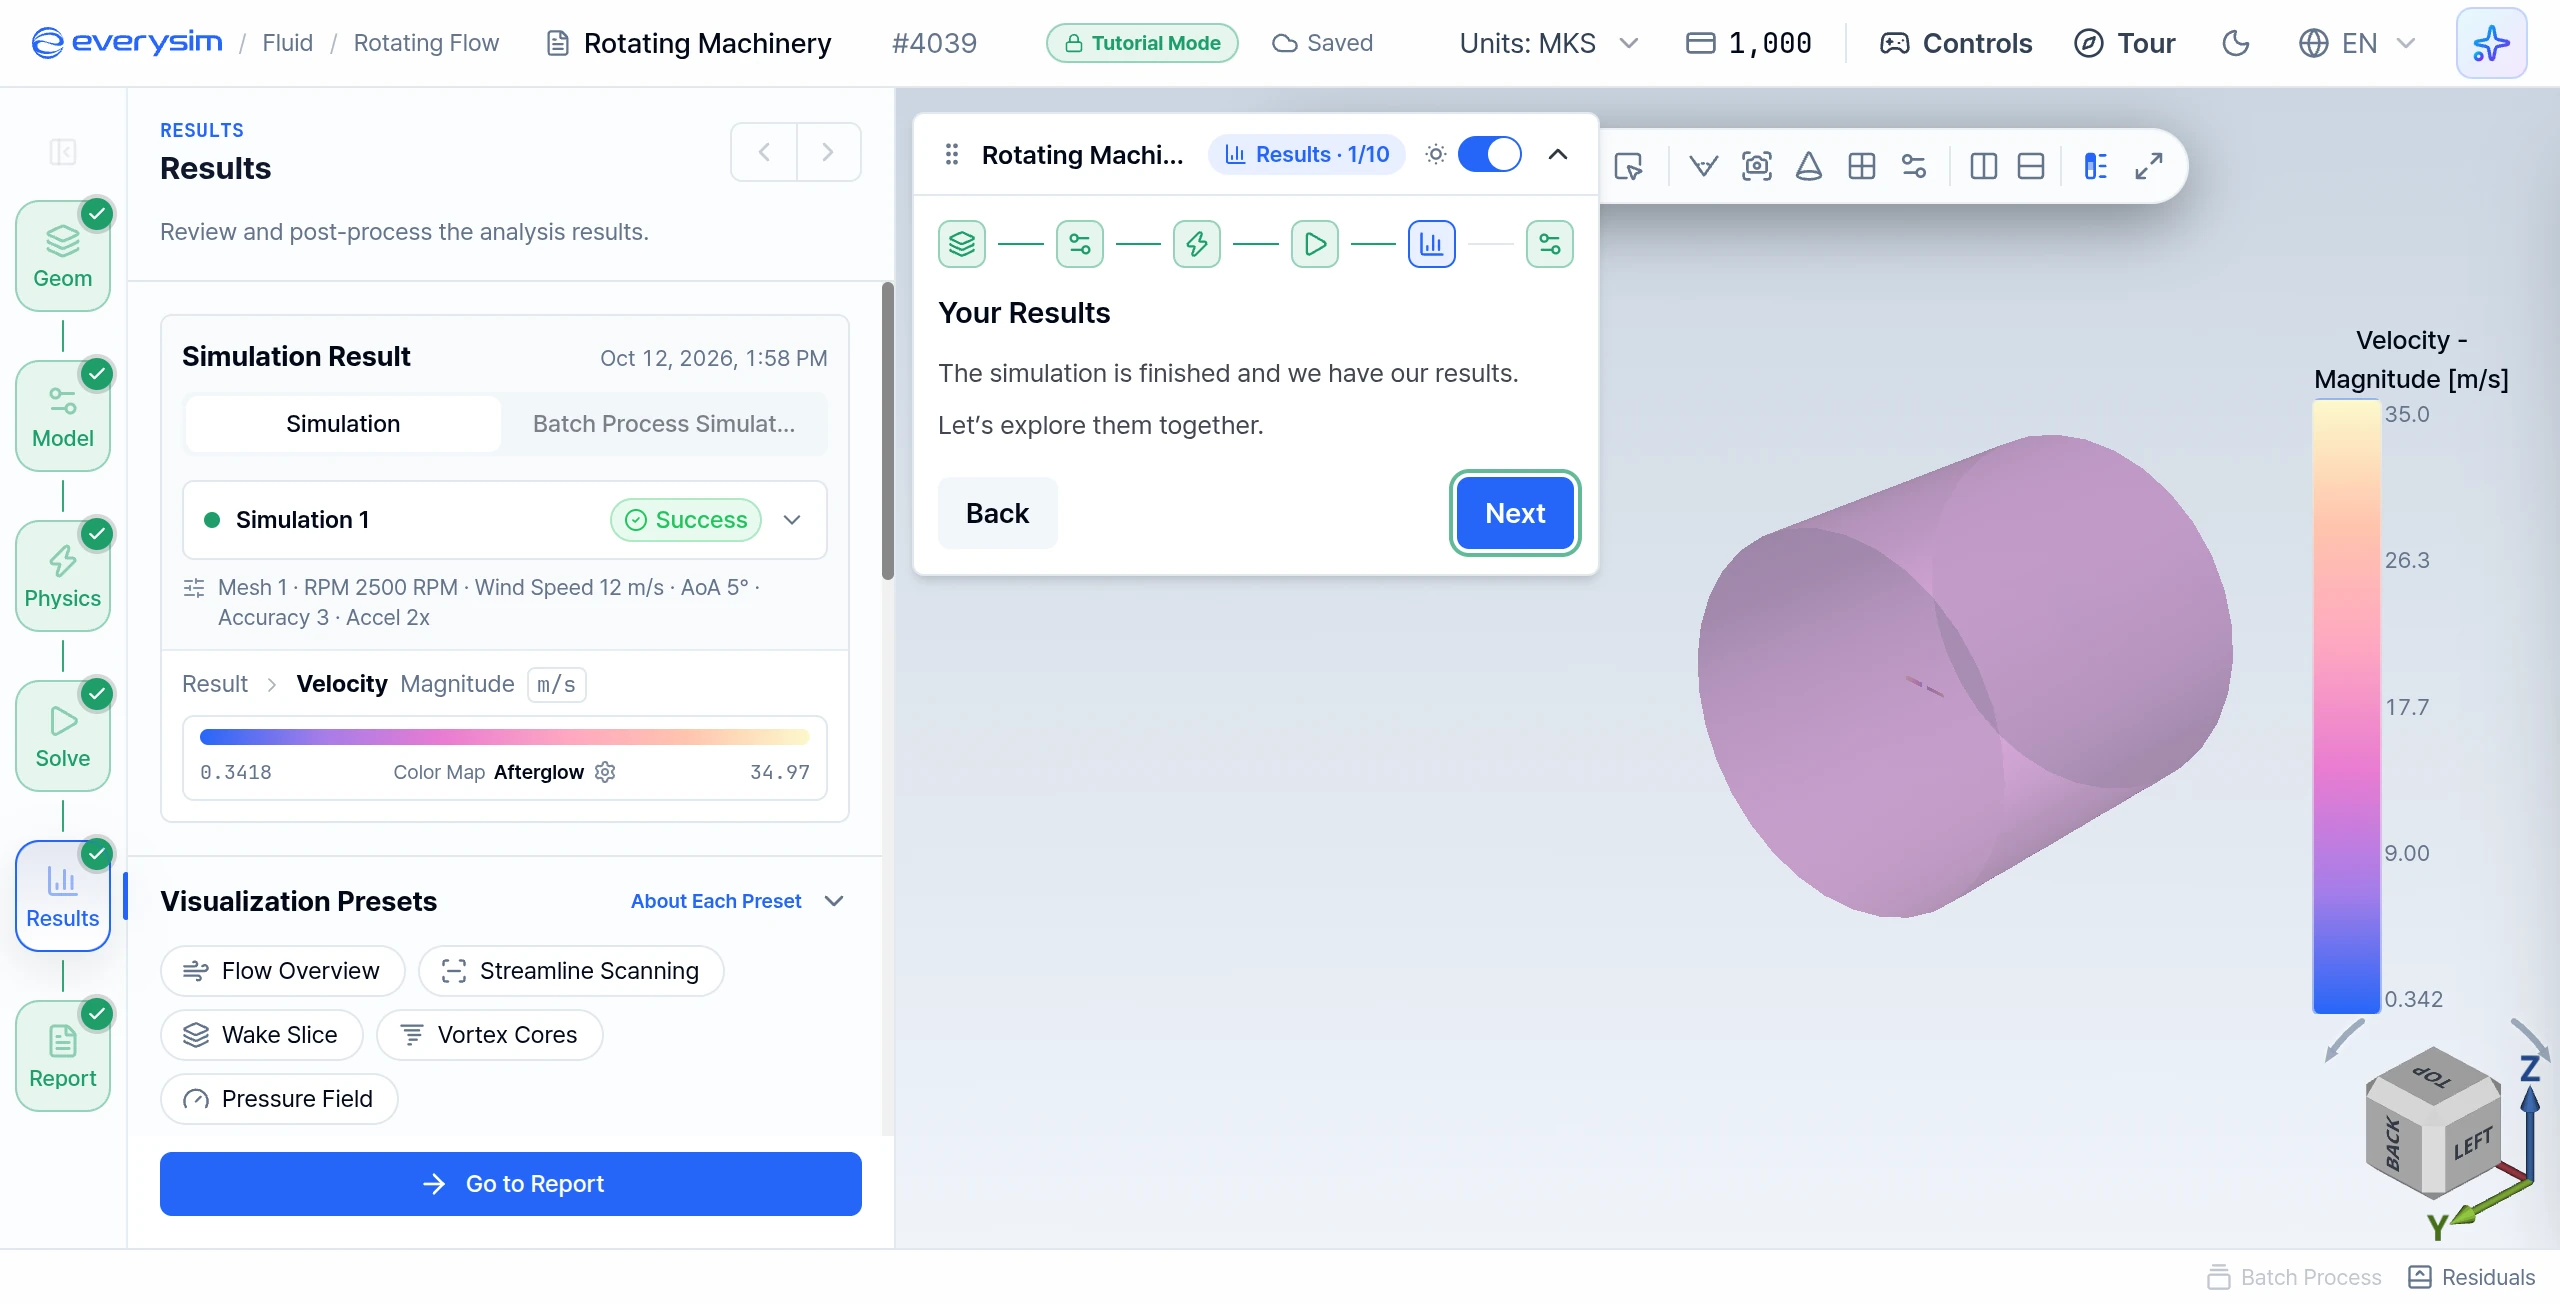
Your Results
The Results panel opens on the velocity magnitude over the whole fluid domain. The simulation card sums up the run: 2500 RPM, Wind Speed 12 m/s, AoA 5°, Accuracy 3, Accel 2x. Click Next.
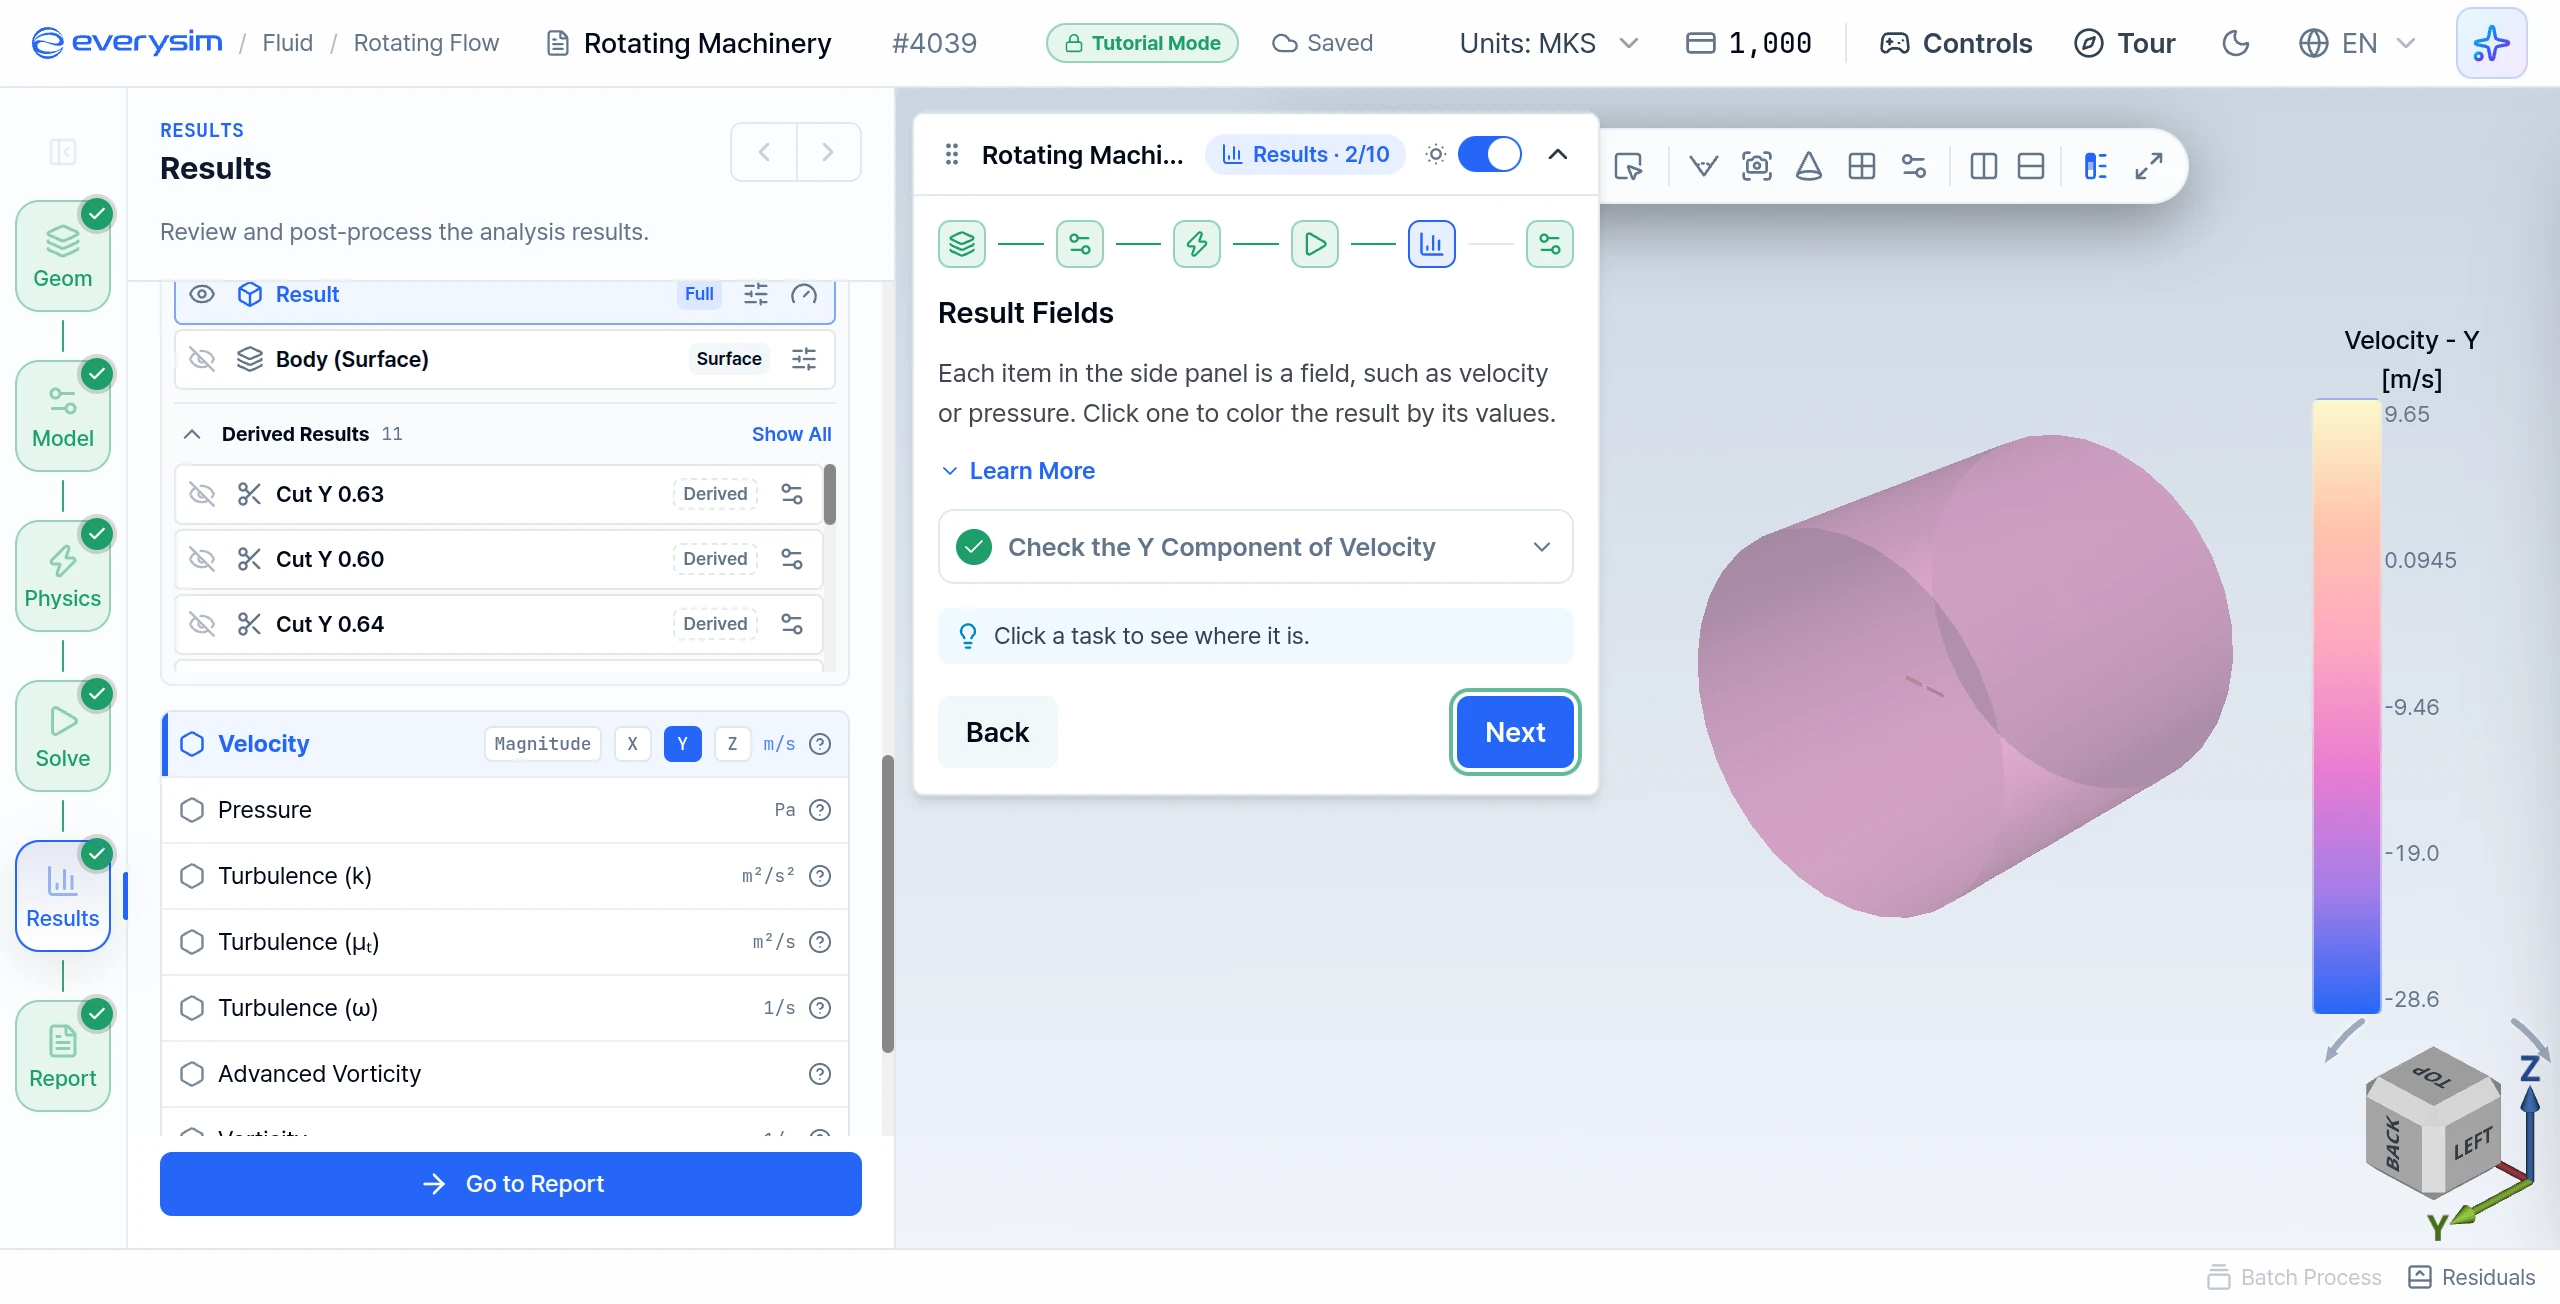
Result Fields
Each item in the side panel is a field. Clicking one colours the result by its values, and the colour bar shows which colour means which value.
- Check the Y Component of Velocity: in Result Fields, click the Y component on the Velocity row, because the flow direction is Y.
- Click Next.
The list also offers Pressure, Turbulence (k), Turbulence (μₜ), Turbulence (ω), Advanced Vorticity, Vorticity, and Wall Shear Stress.
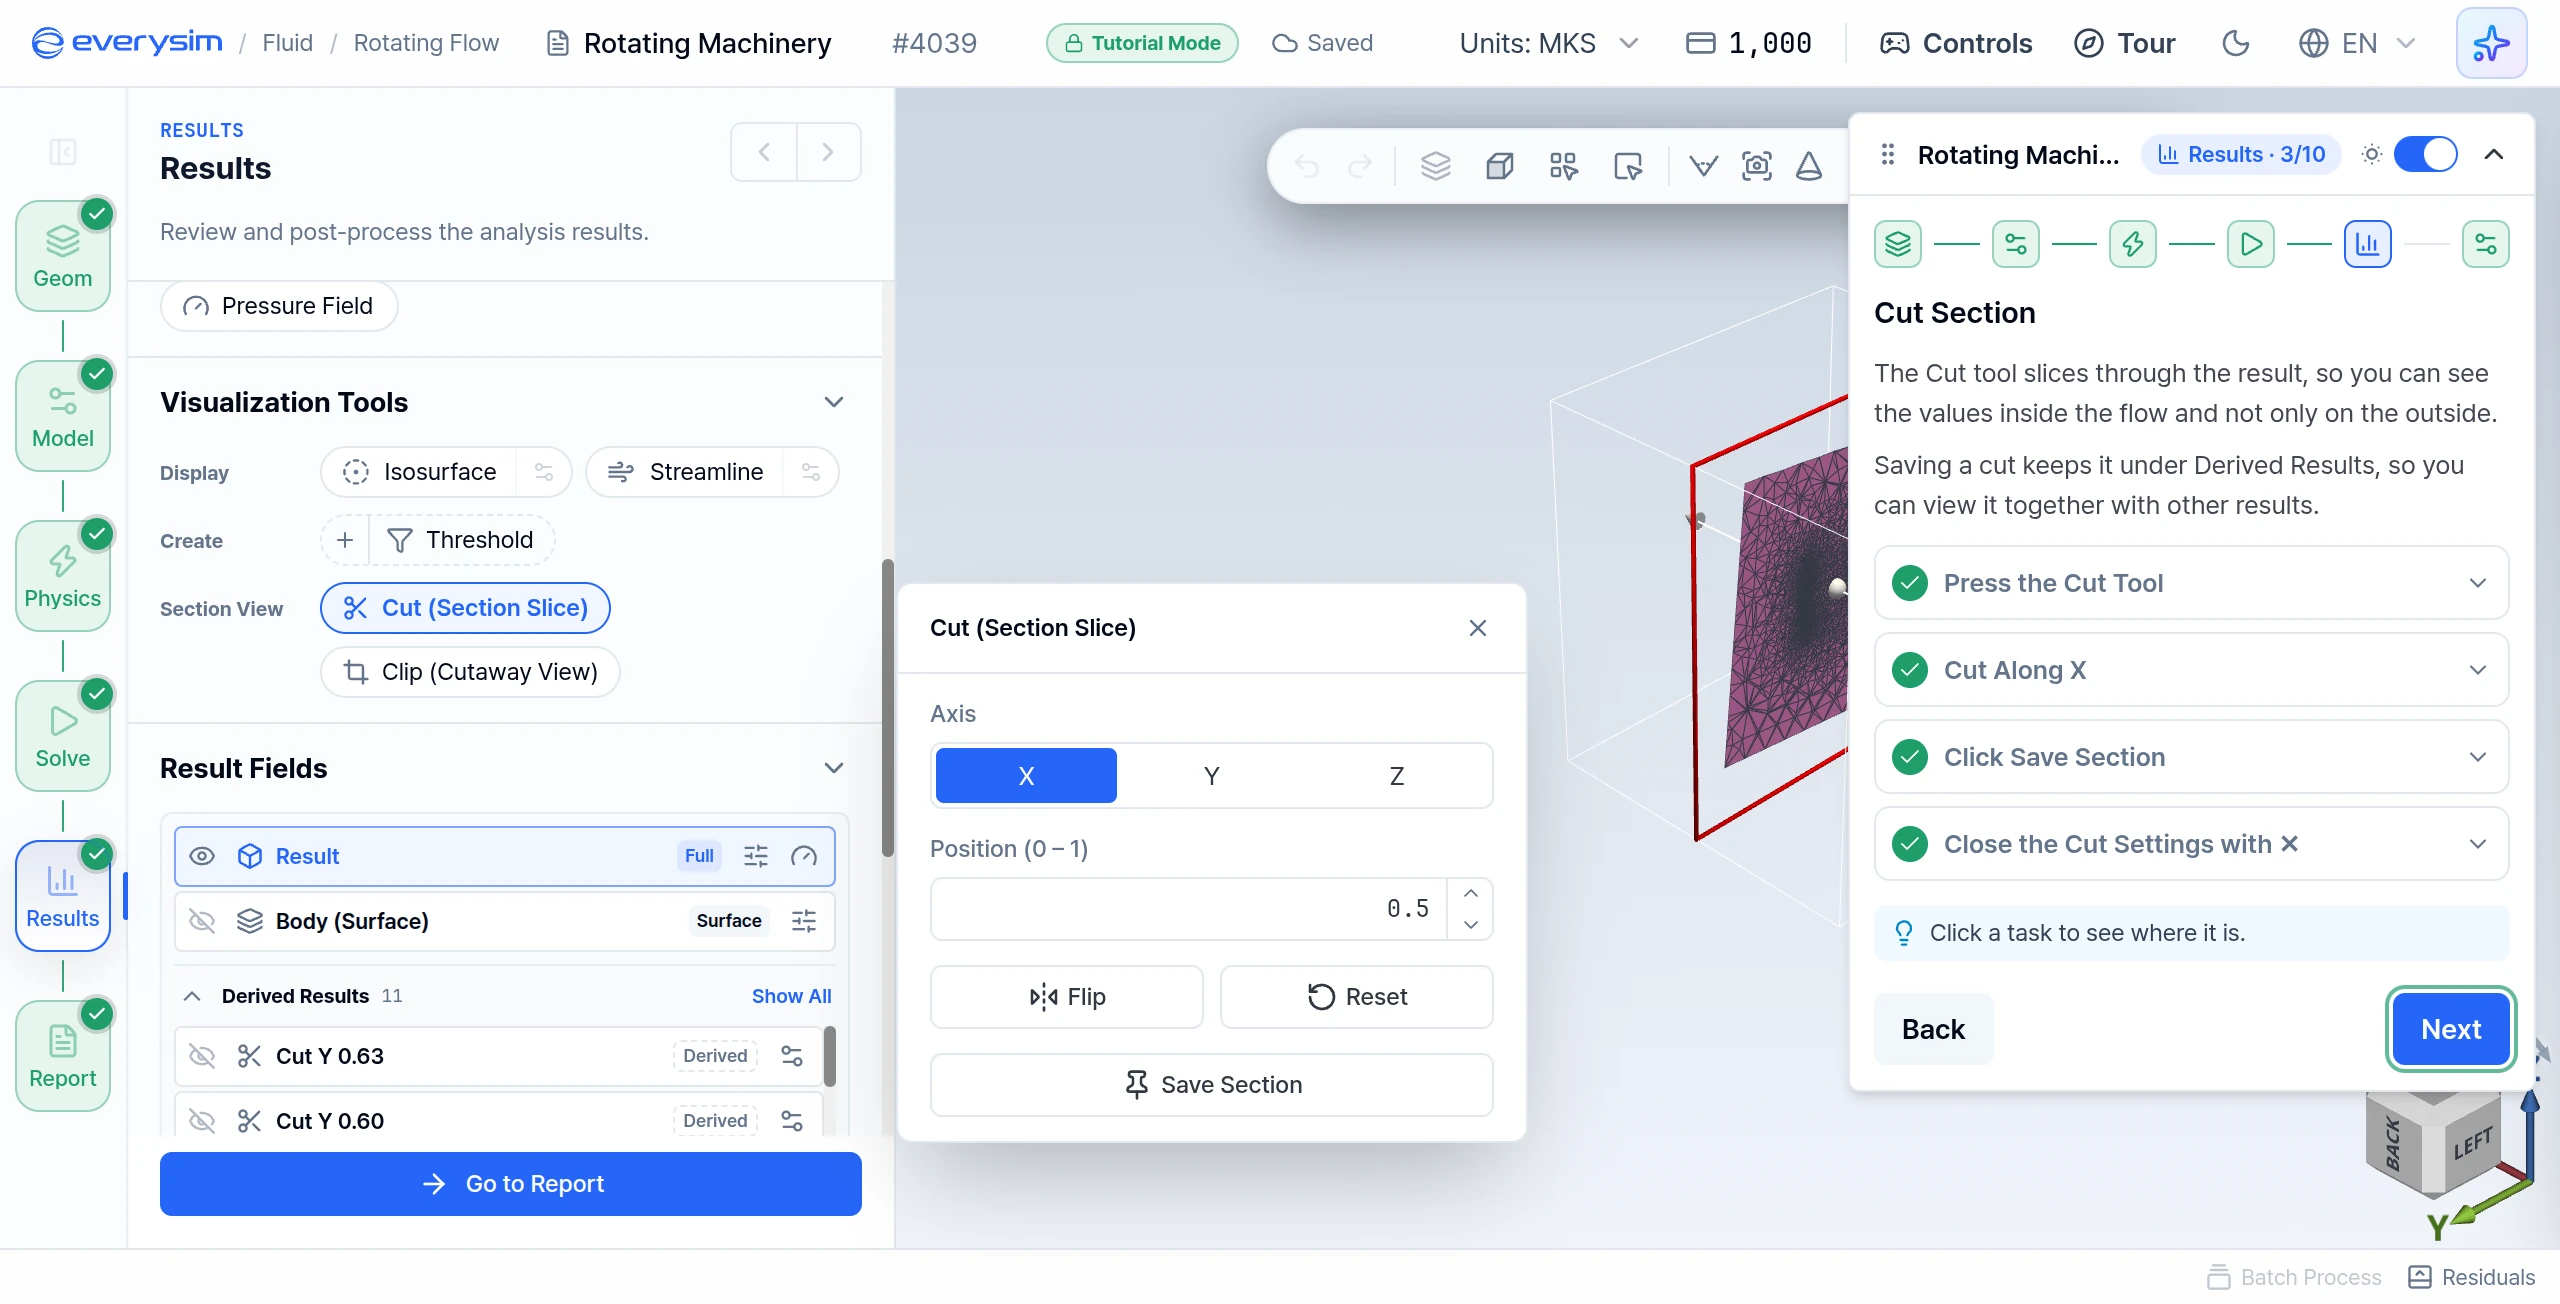
Cut Section
The Cut tool slices through the result, so you can see the values inside the flow. Saving a cut keeps it under Derived Results, where you can view it together with other results.
- Press the Cut Tool: under Visualization Tools, press Cut (Section Slice) in the Section View row. Its settings open beside the panel.
- Cut Along X: choose X as the axis, to see how the results are distributed along the flow direction.
- Click Save Section: this saves the cut under Derived Results as
Cut X 0.50. - Close the Cut Settings with ✕: closing them turns the tool off. The adjusting plane goes away and only the saved cut is left.
- Click Next.
Camera View
Set the Camera View to -X: open Camera View in the toolbar above the viewport and choose -X, so you face the cut straight on. Then click Next.
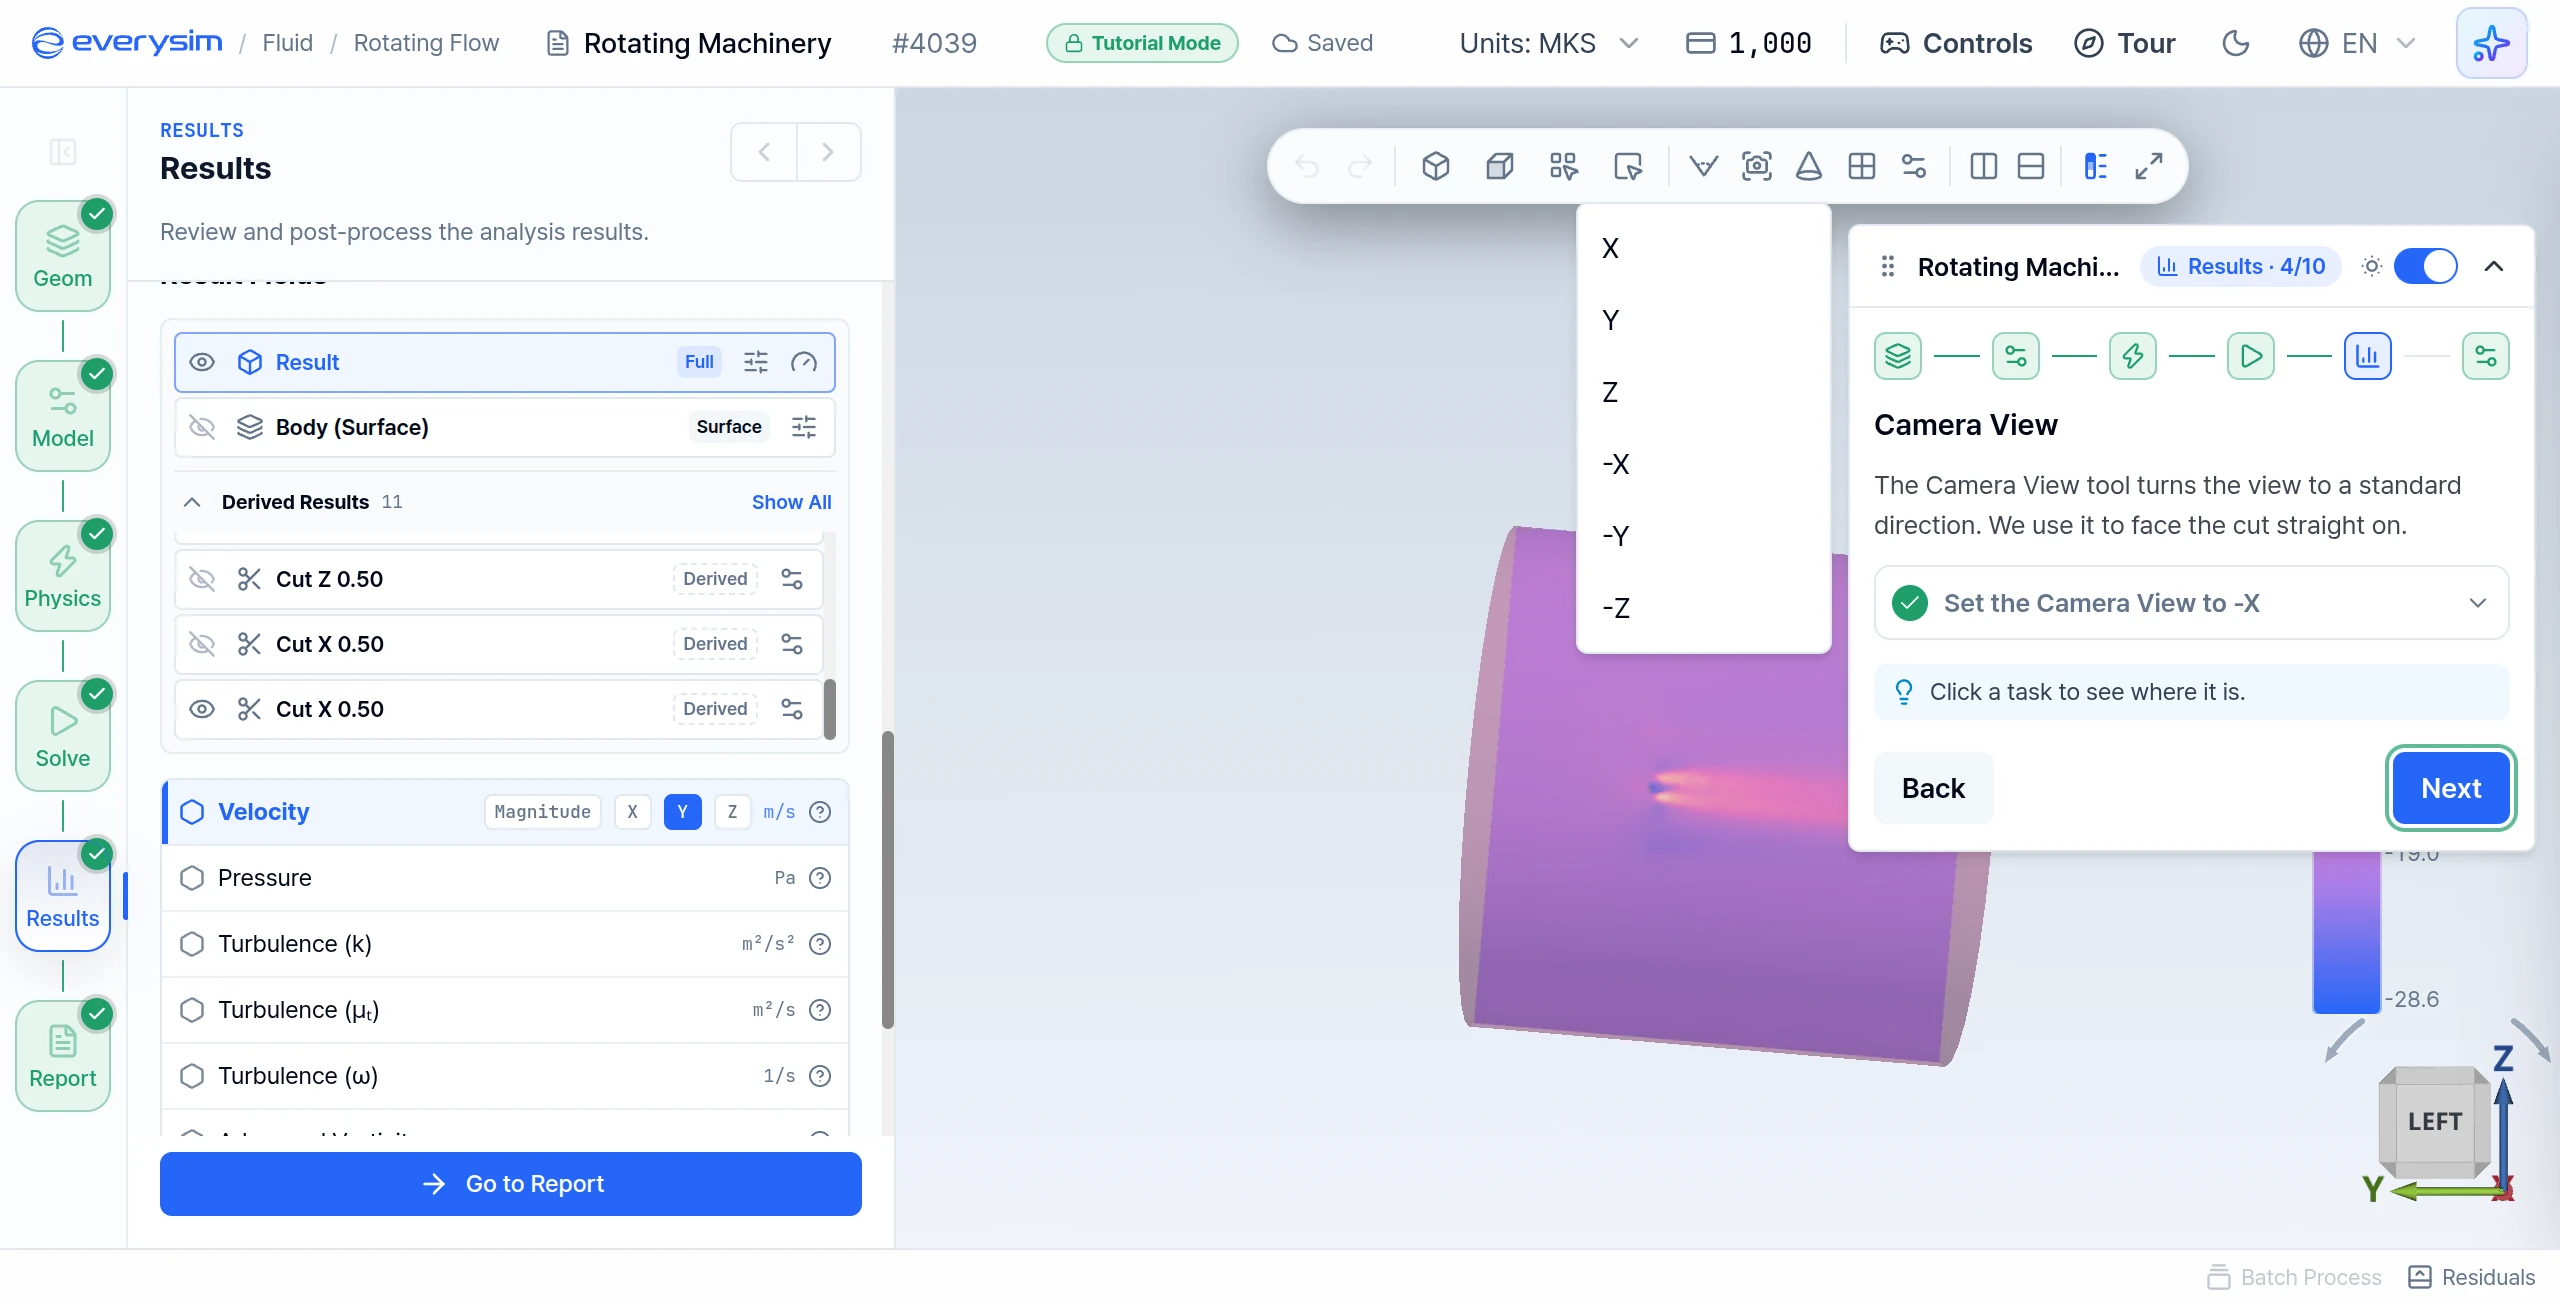
View the Cut Together with the Body
A fluid result comes in two ways. Result shows everything, including the fluid around the propeller. Body (Surface) shows only the surface of your geometry. A derived result, such as your cut, can be selected as well.
- Click Body (Surface): the fluid domain goes away and only the propeller surface stays.
- Click the Cut: click the cut's name under Derived Results. The cut is now selected, so the next field you choose shows on it.
- Click Next.
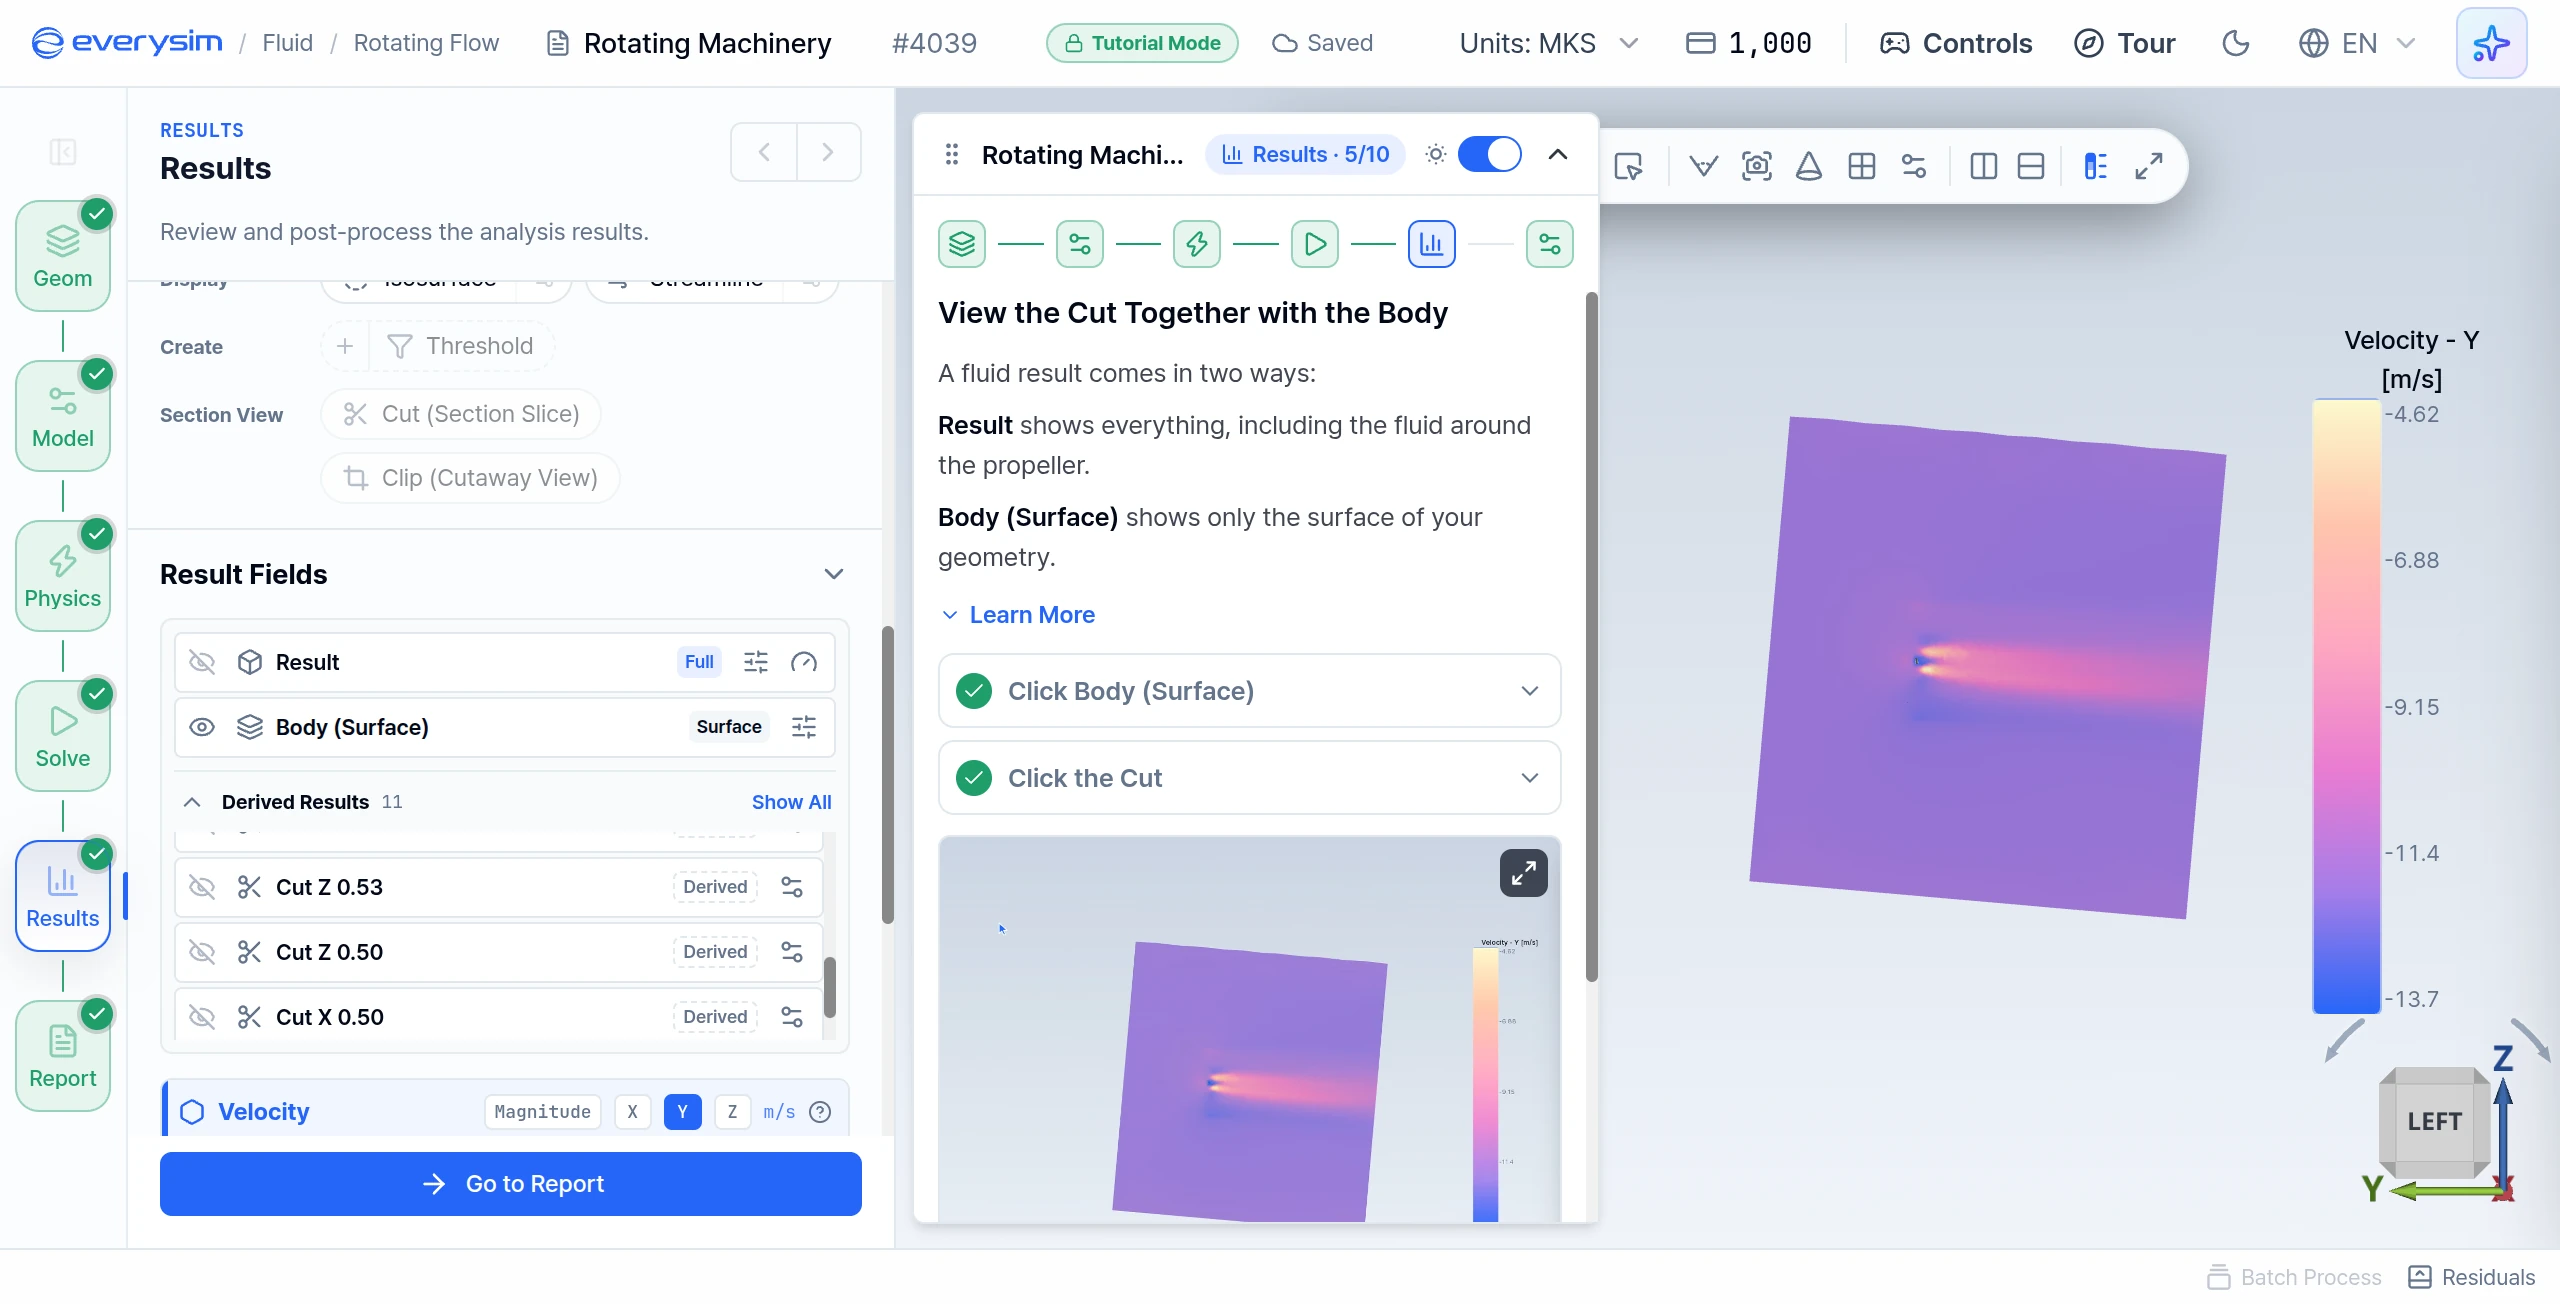
View Turbulence on the Cut
Fields apply to whatever is selected.
- Click Turbulence (μₜ): the cut shows how the flow changes as it passes the propeller.
- Click Next.
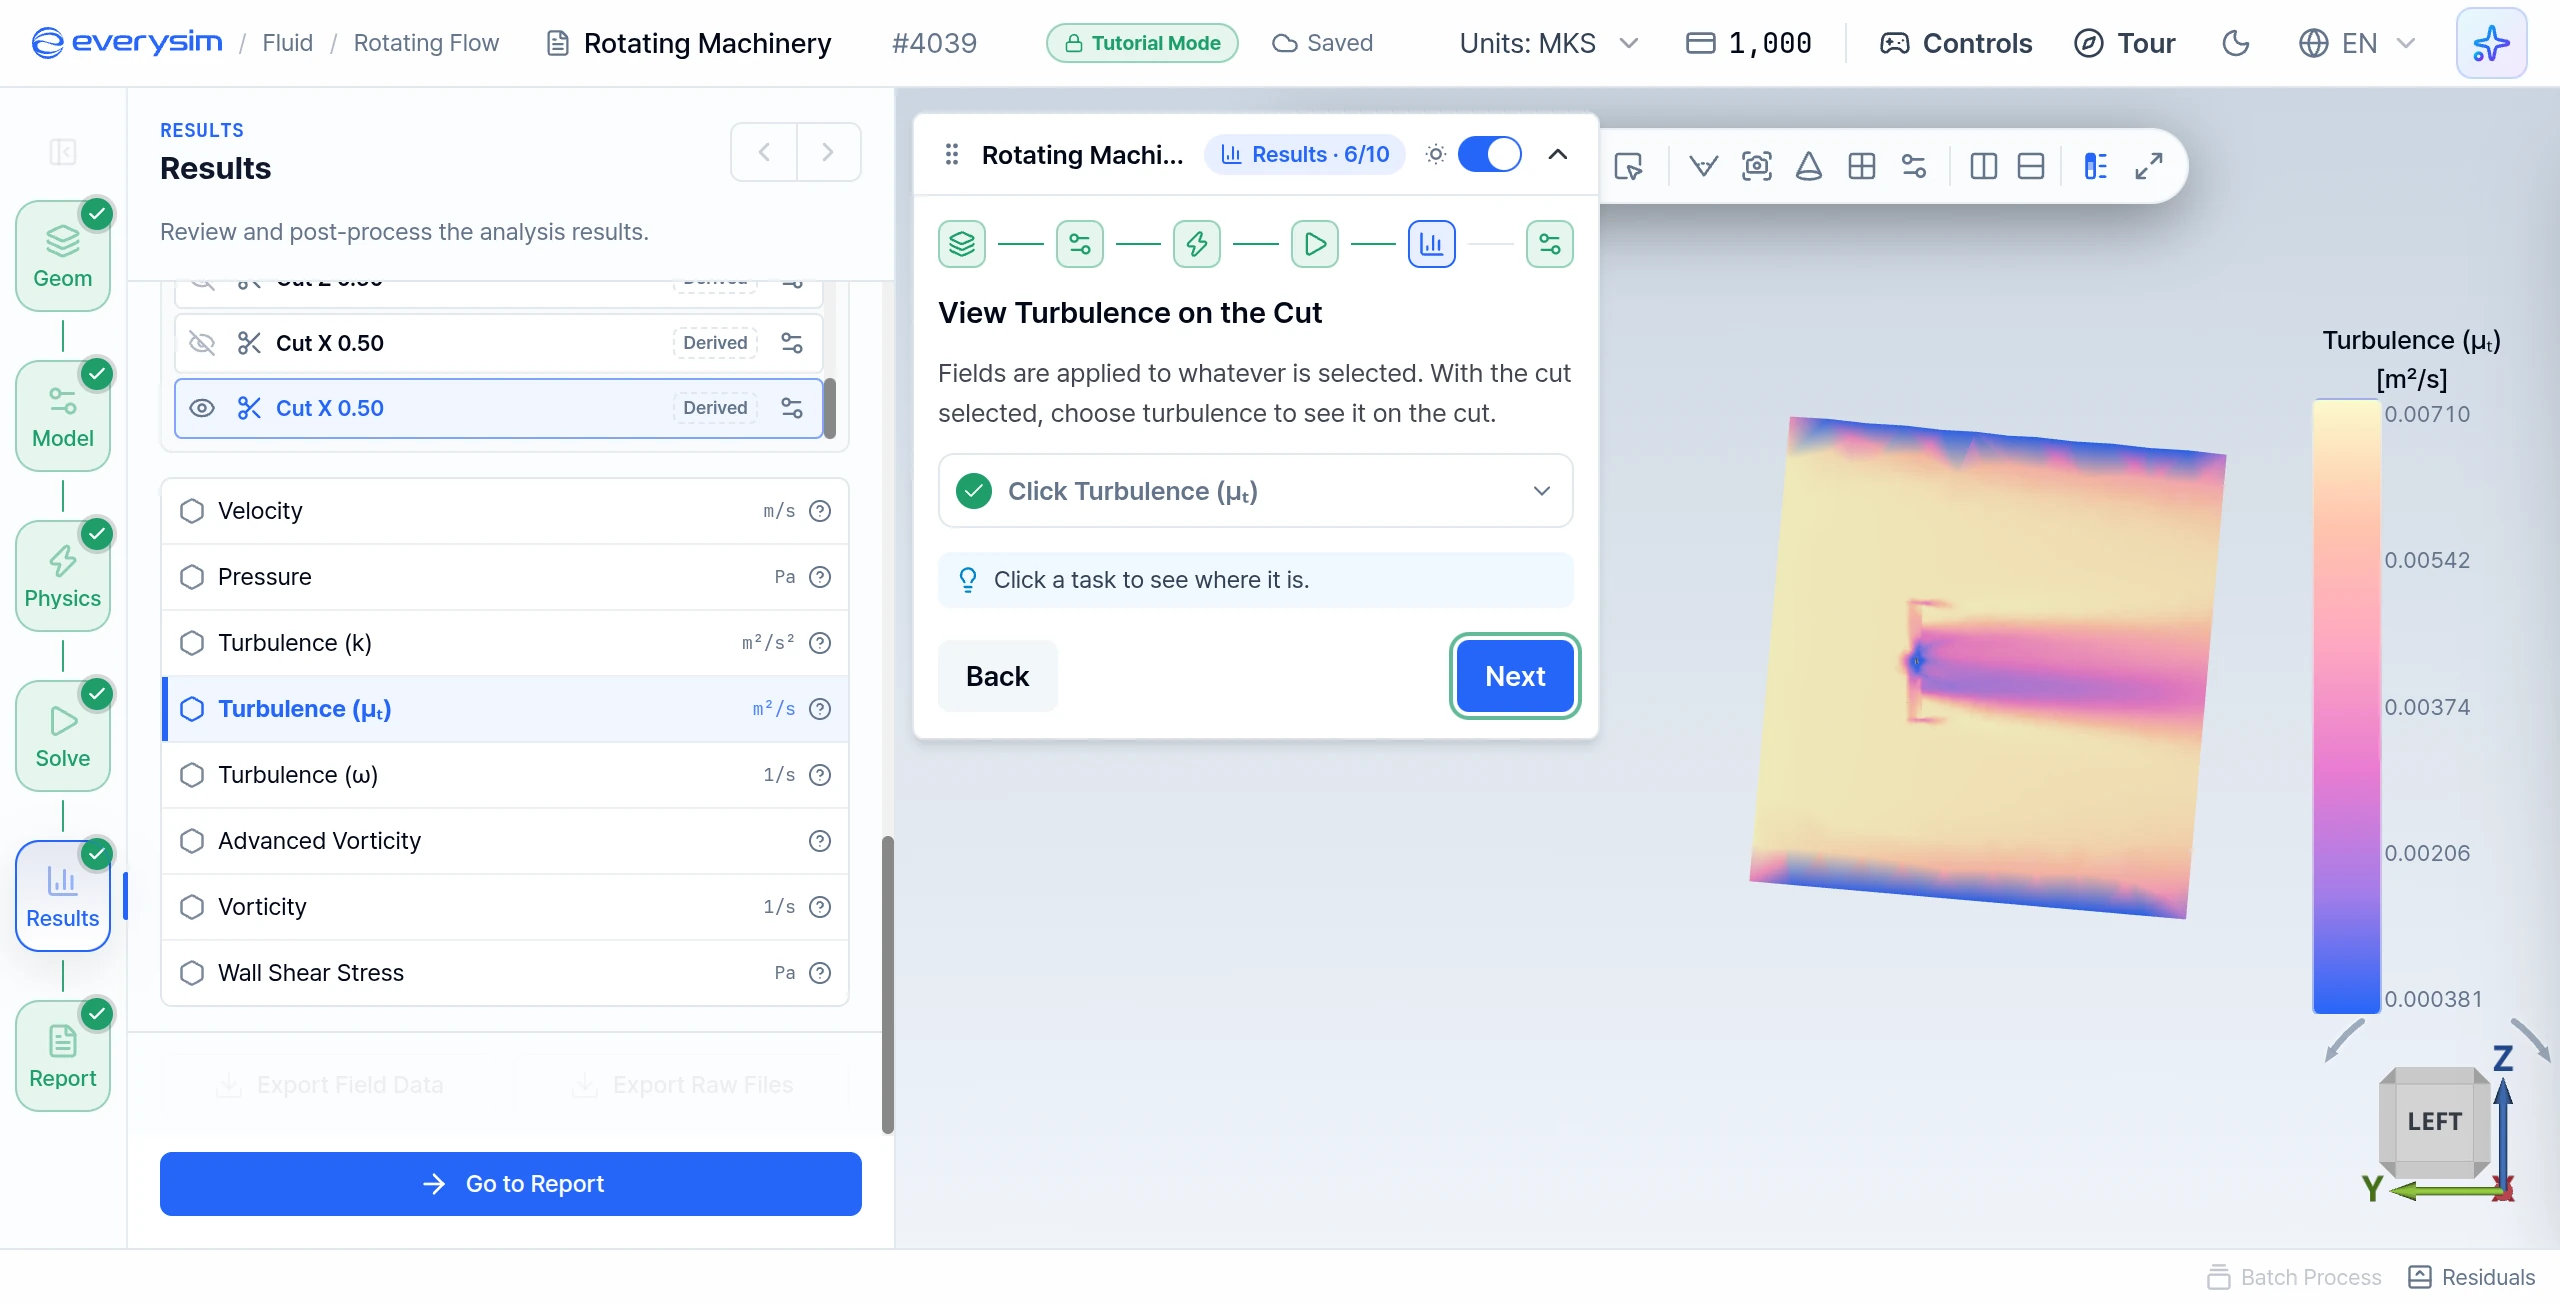
Prepare the Flow View
Before moving on, make the body the active result.
- Hide the Cut: click the eye on the cut's row.
- Click Body (Surface) Again: the body becomes the active result and the view turns to the Z direction.
- Click Next.
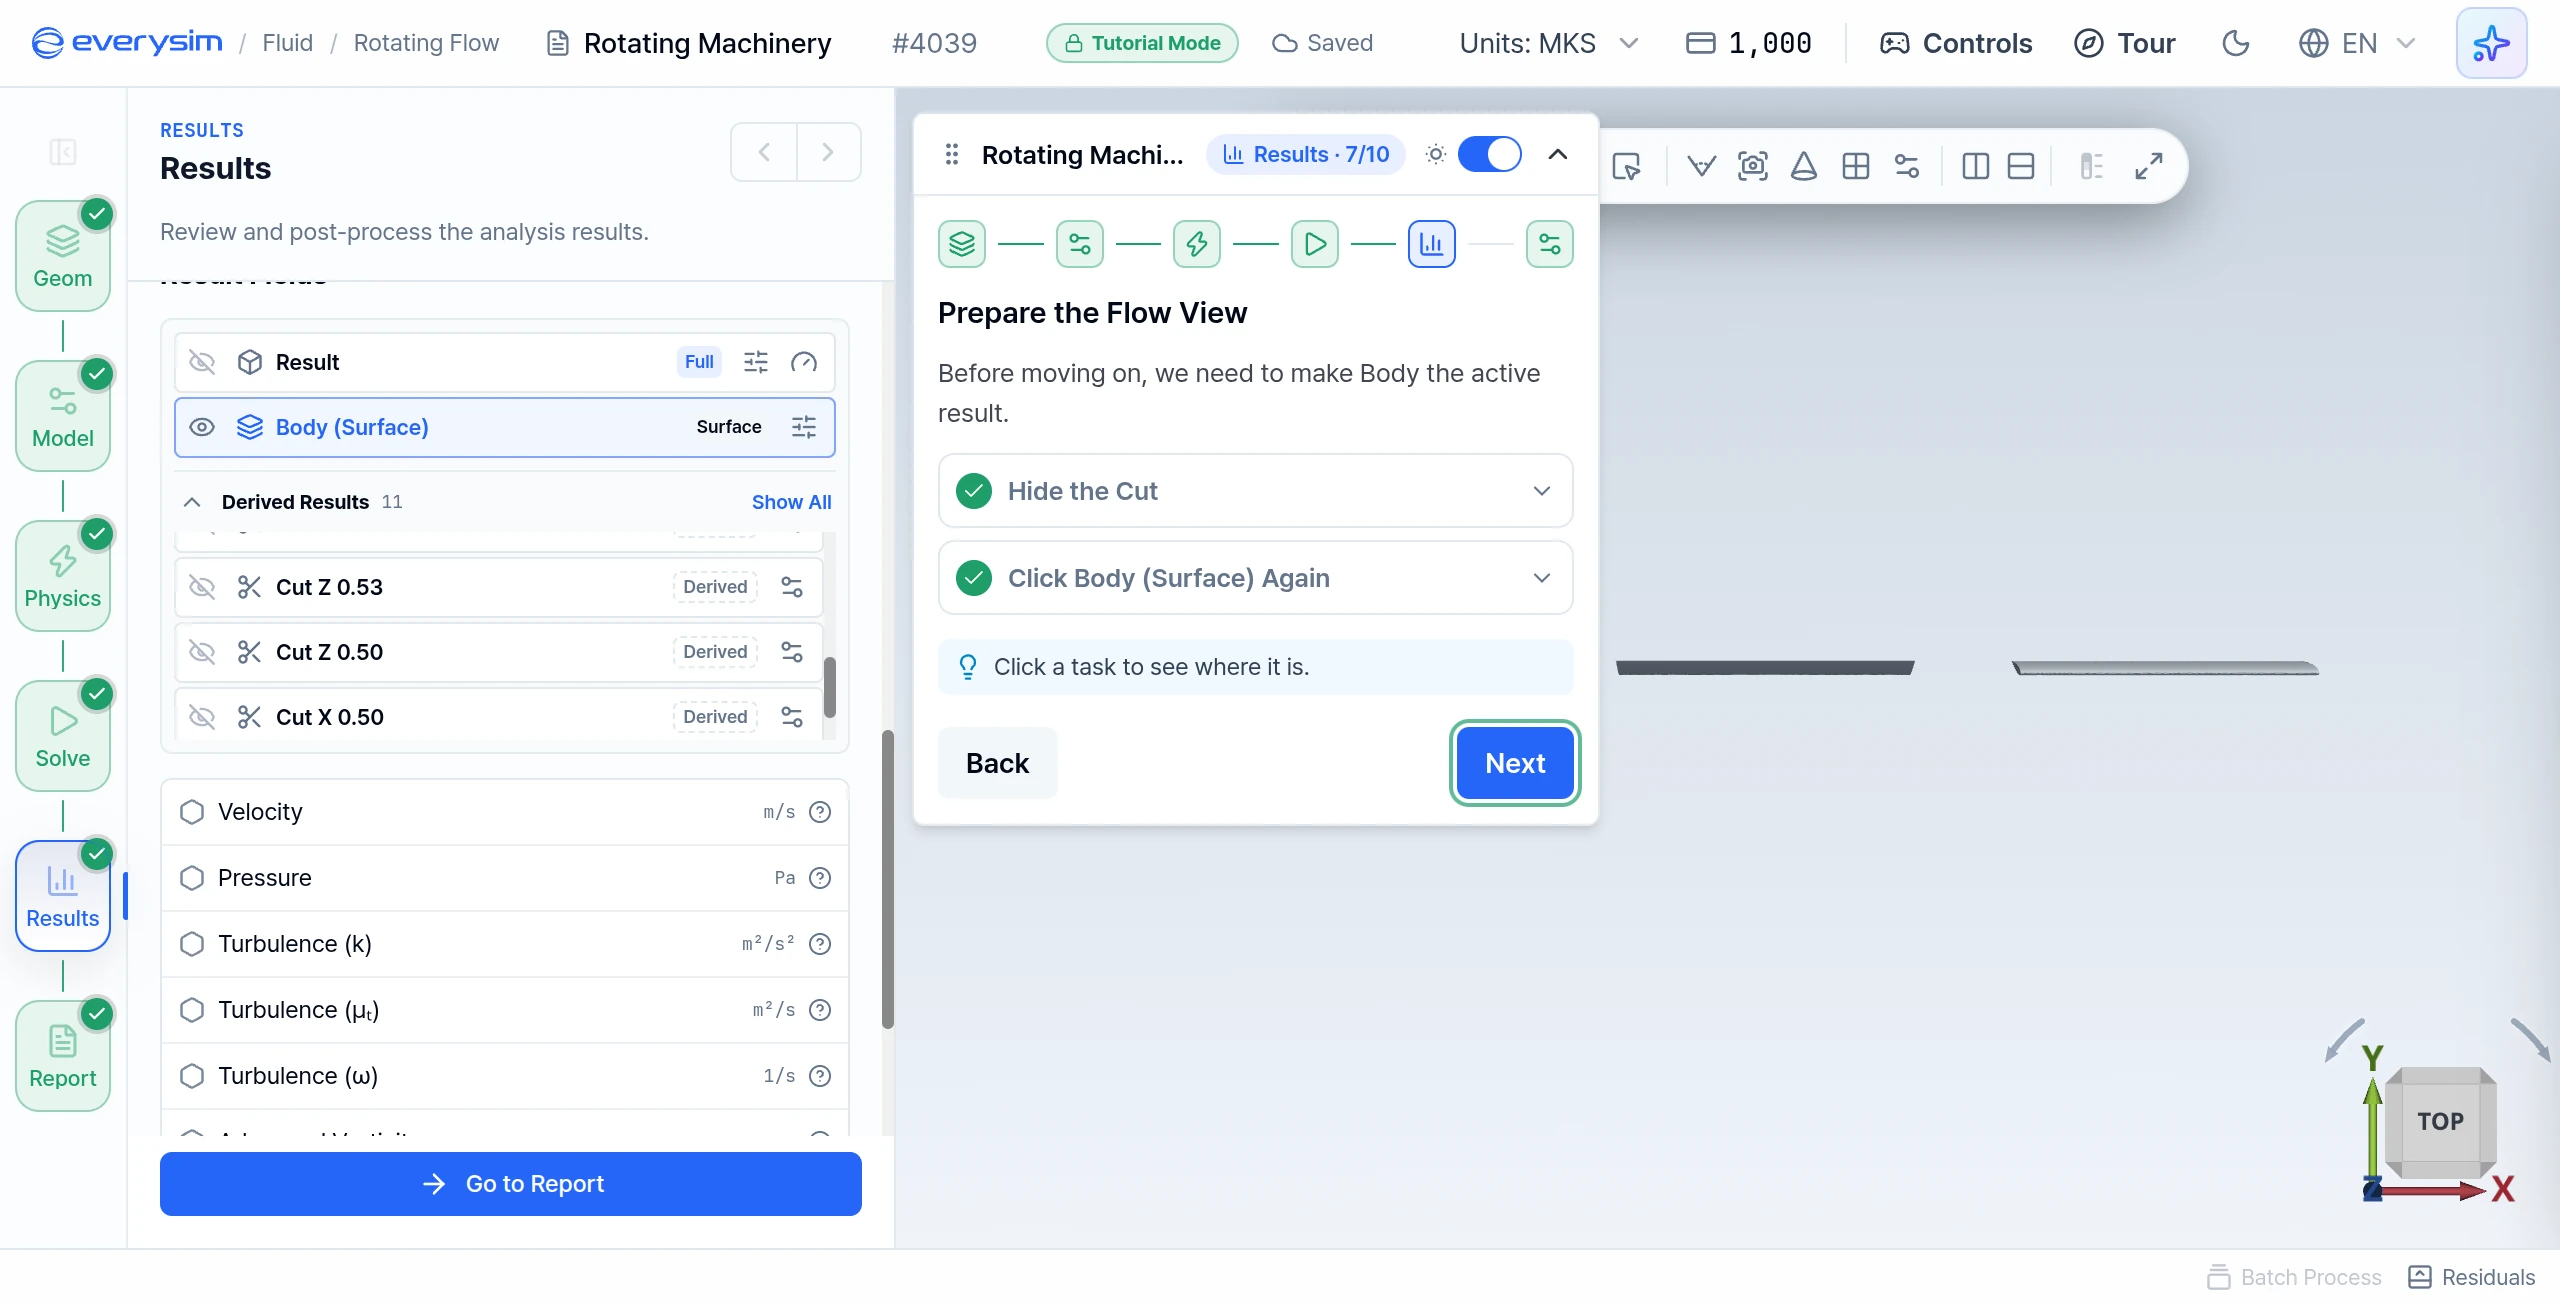
Flow and Pressure Distribution
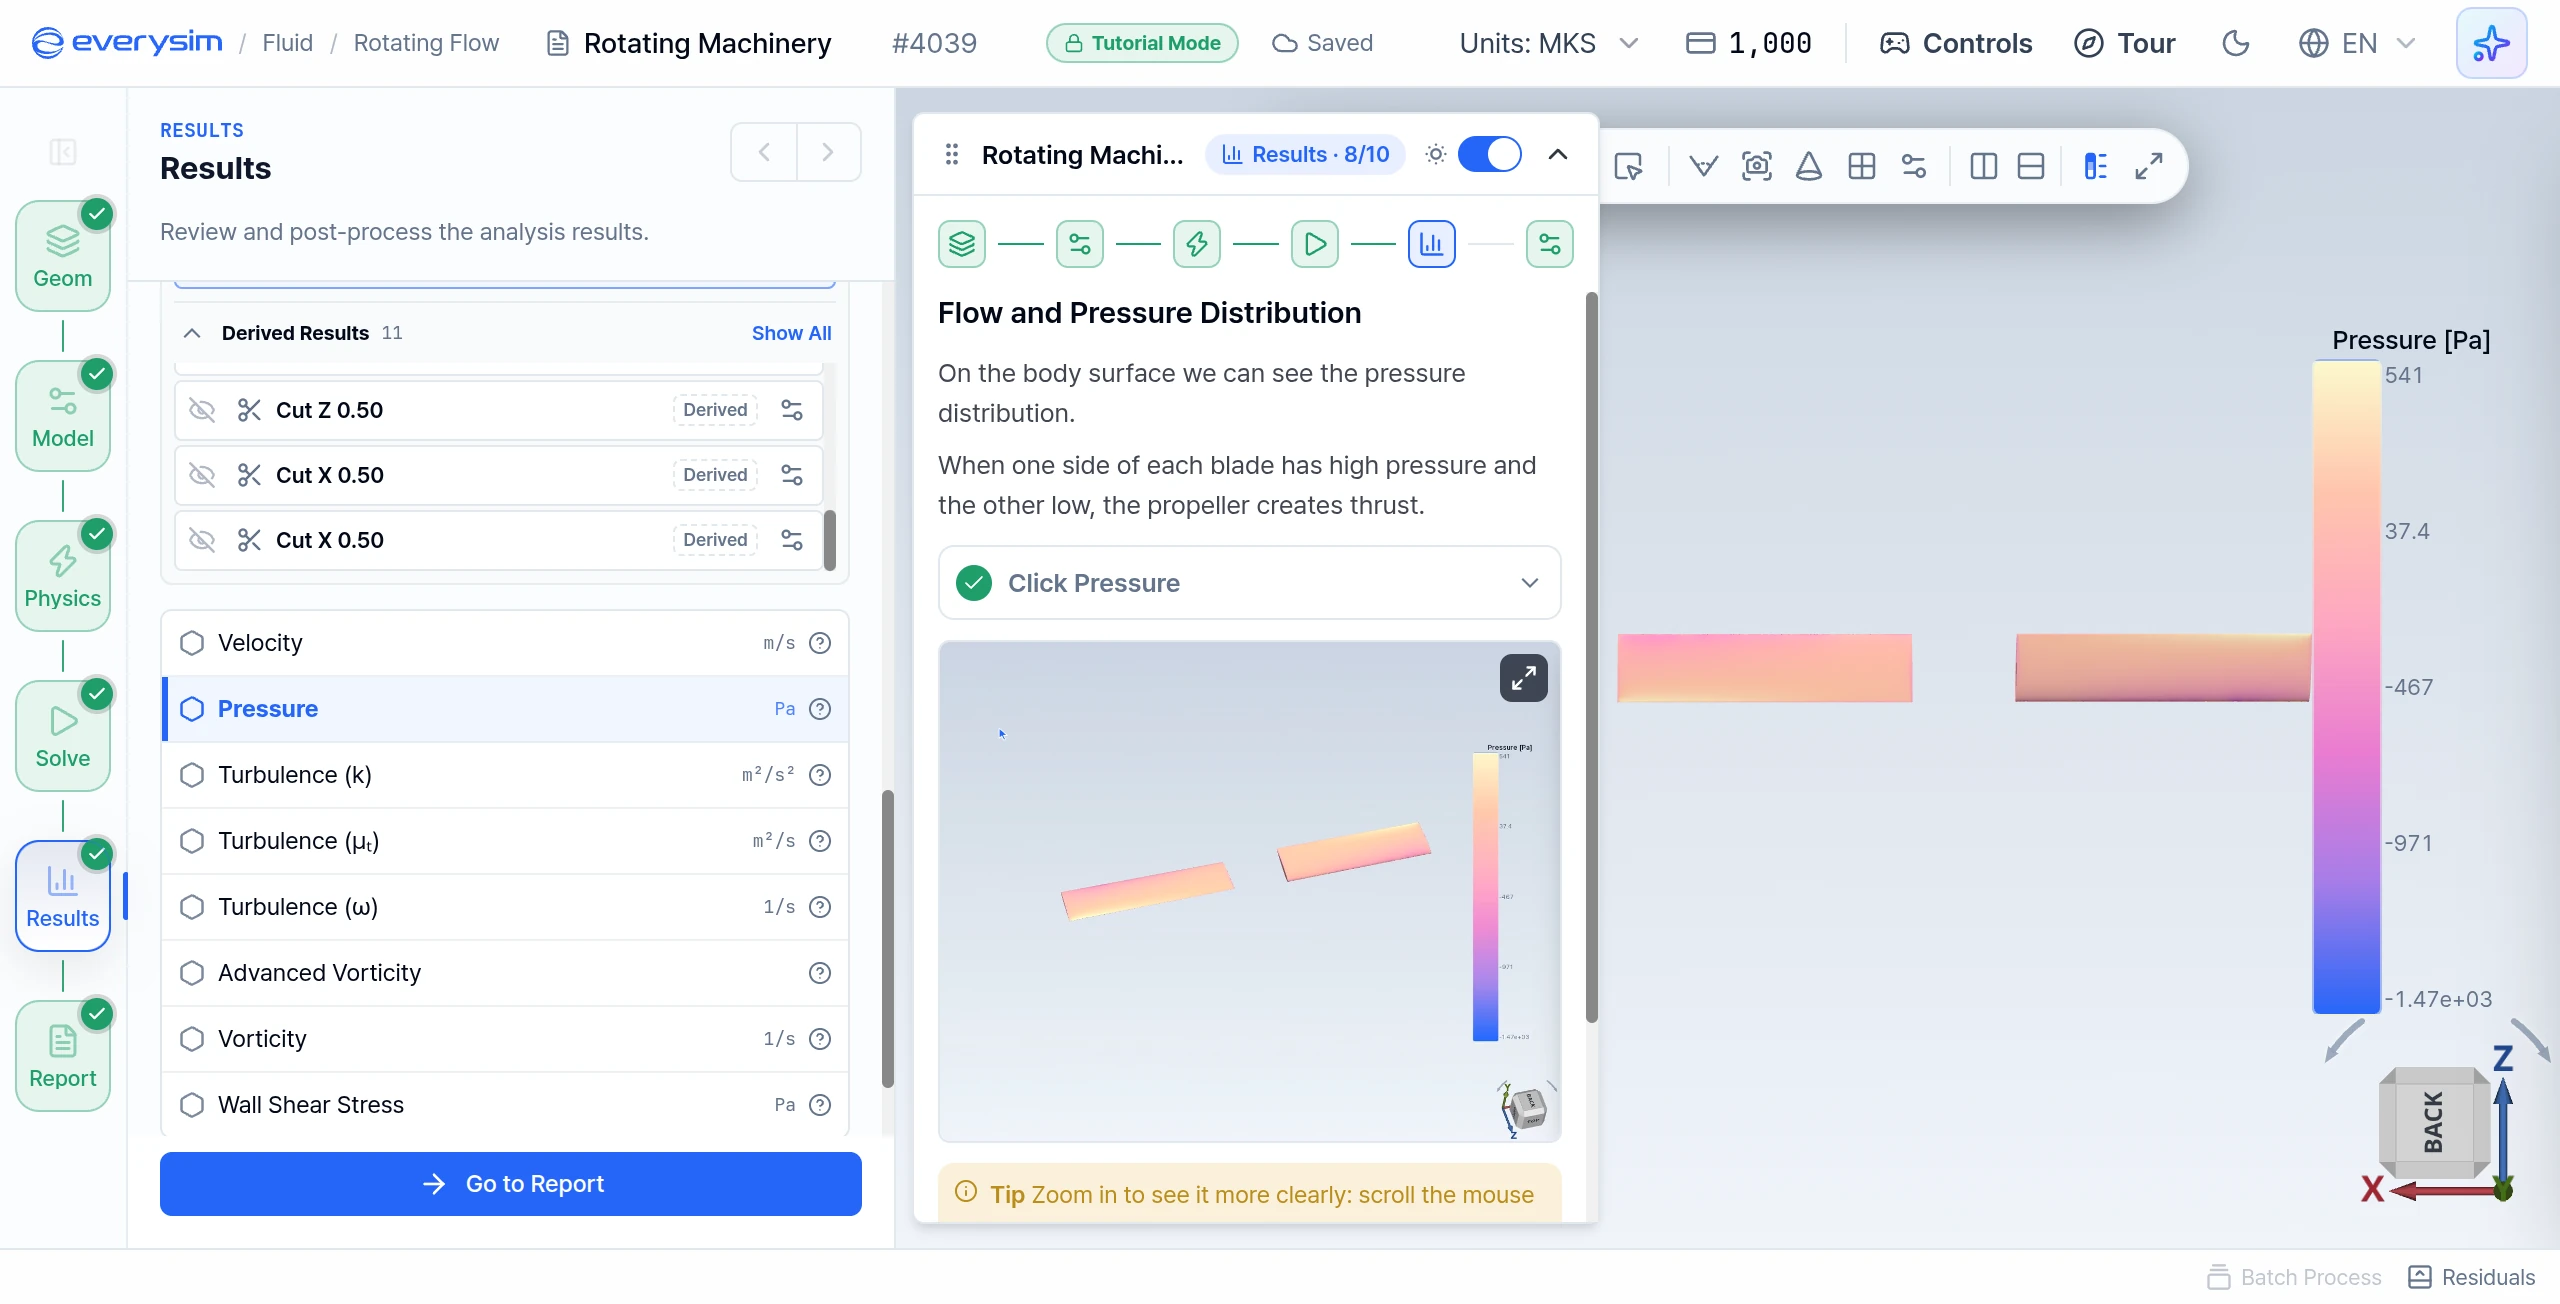
On the body surface you can see the pressure distribution. When one side of each blade has high pressure and the other low, the propeller creates thrust.
- Click Pressure: compare the colours on the two sides of a blade. The view stays on Z, where the blades are seen edge-on, so rotate it to see the faces. The figure looks along the Y axis. Scroll the mouse wheel over the viewport to zoom in.
- Click Next.
Streamline Animation
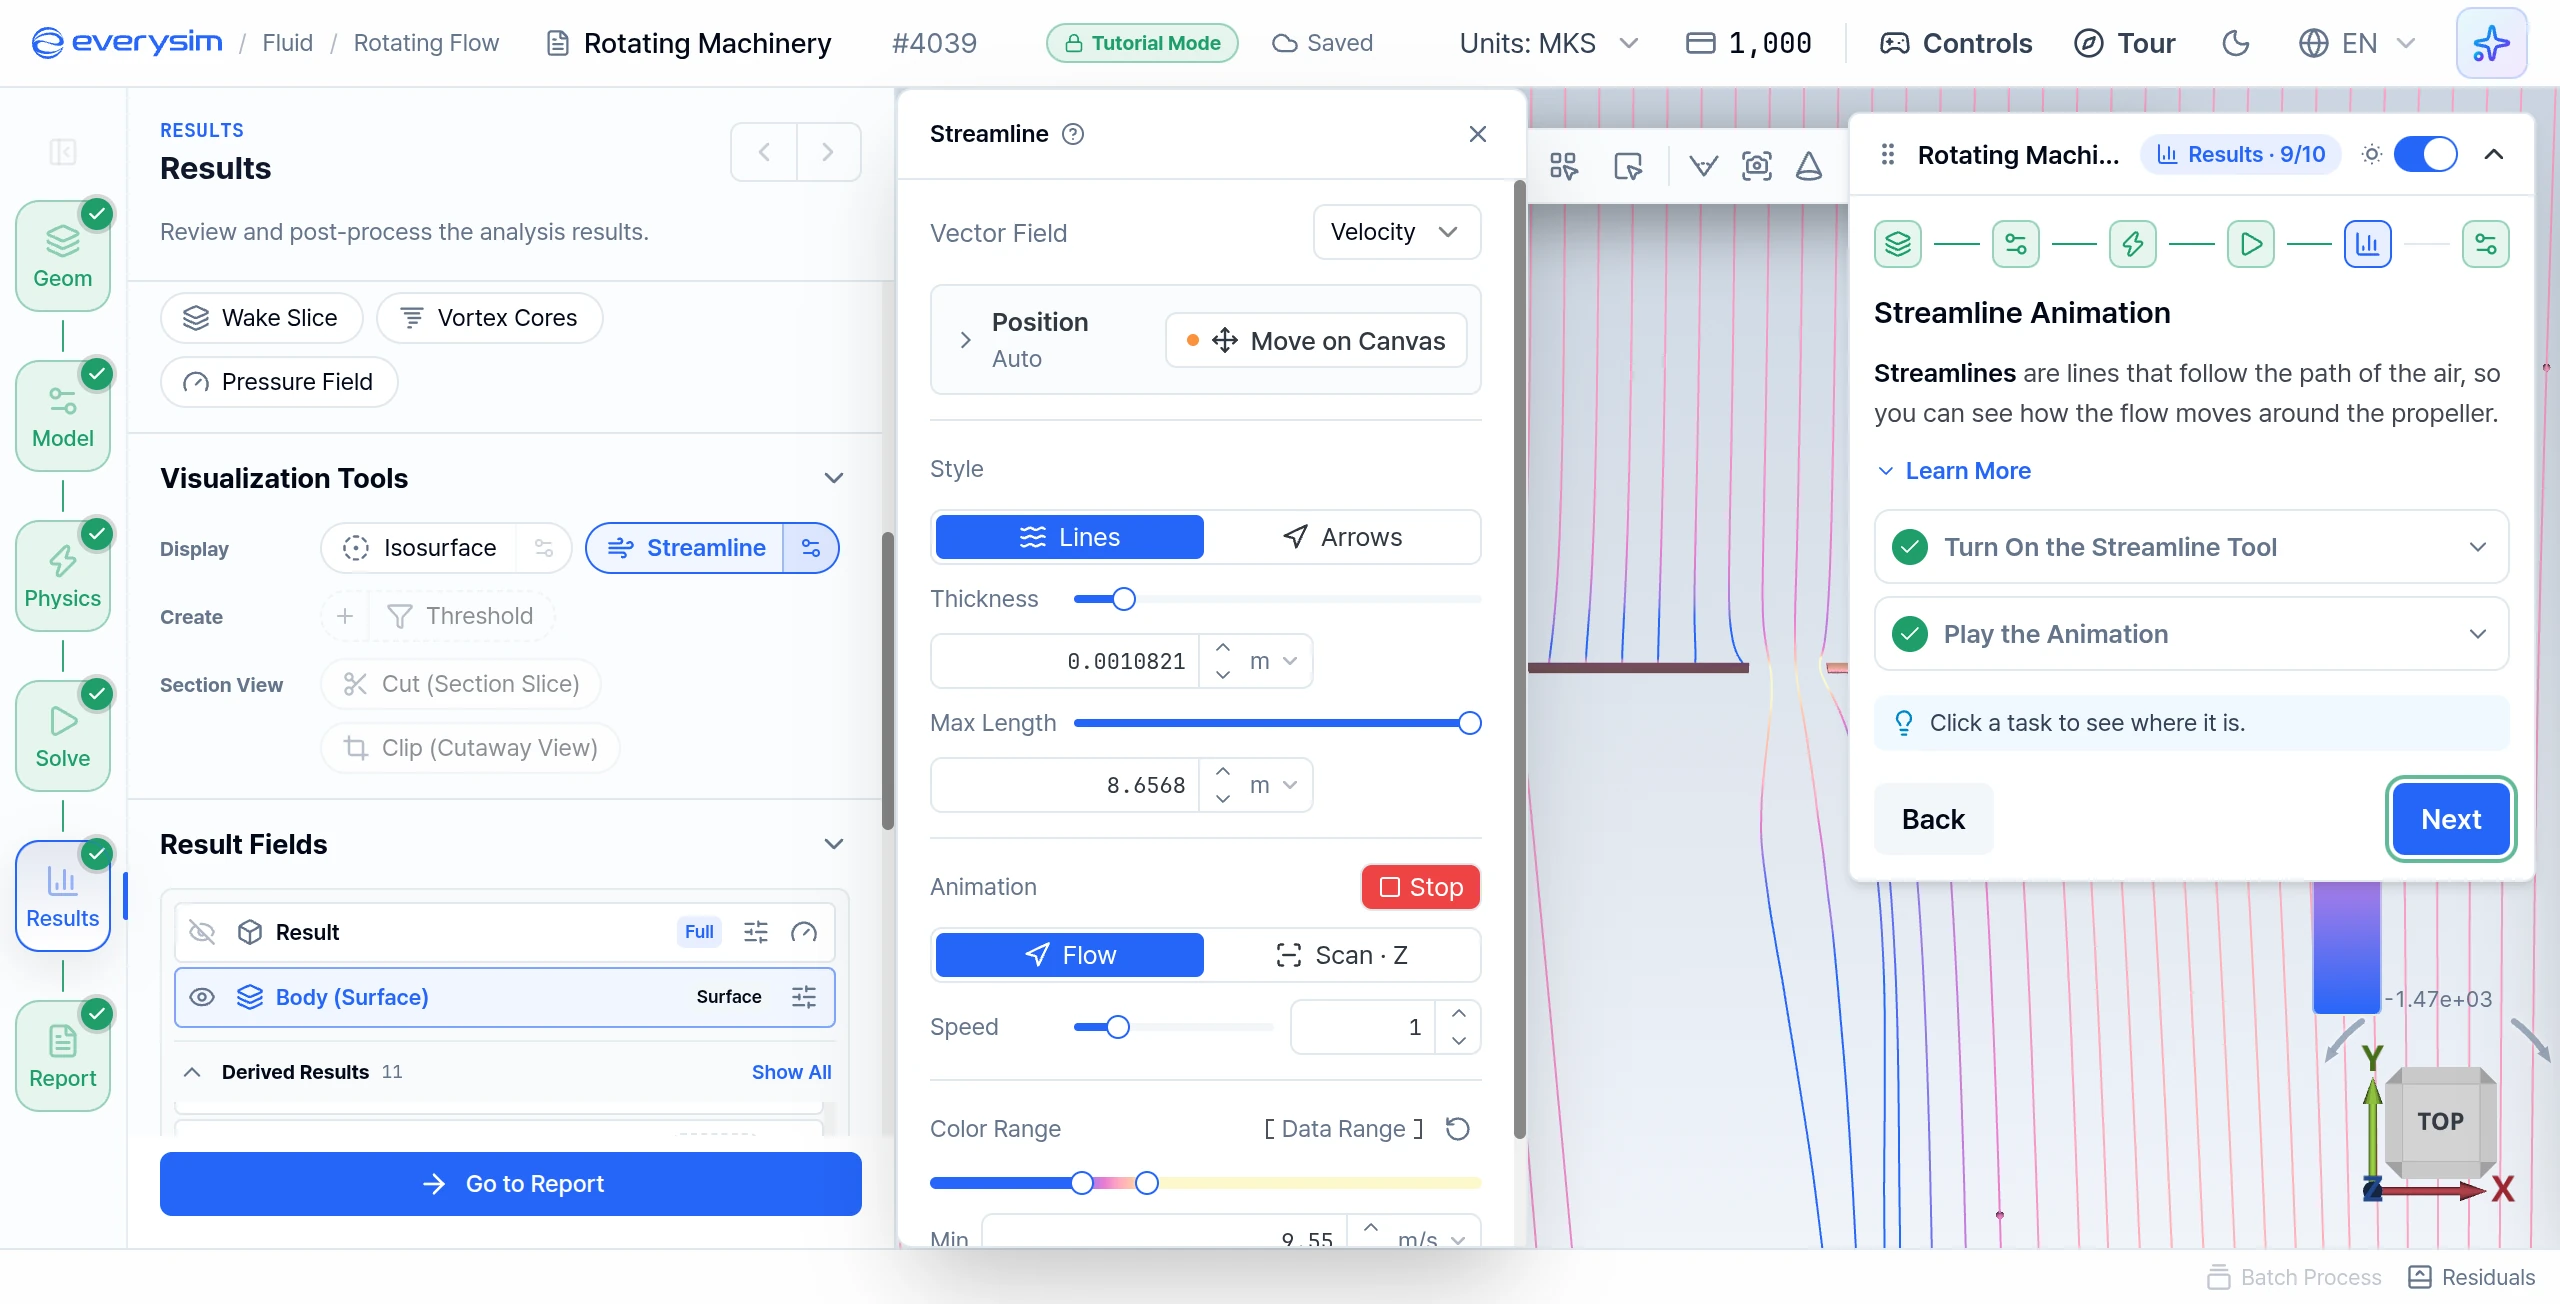
Streamlines follow the path of the air, so you can see how the flow moves around the propeller.
- Turn On the Streamline Tool: under Visualization Tools, switch on Streamline. Its settings open right away.
- Play the Animation: choose Lines or Arrows, then press Play in the Animation row.
- Click Next.
Report
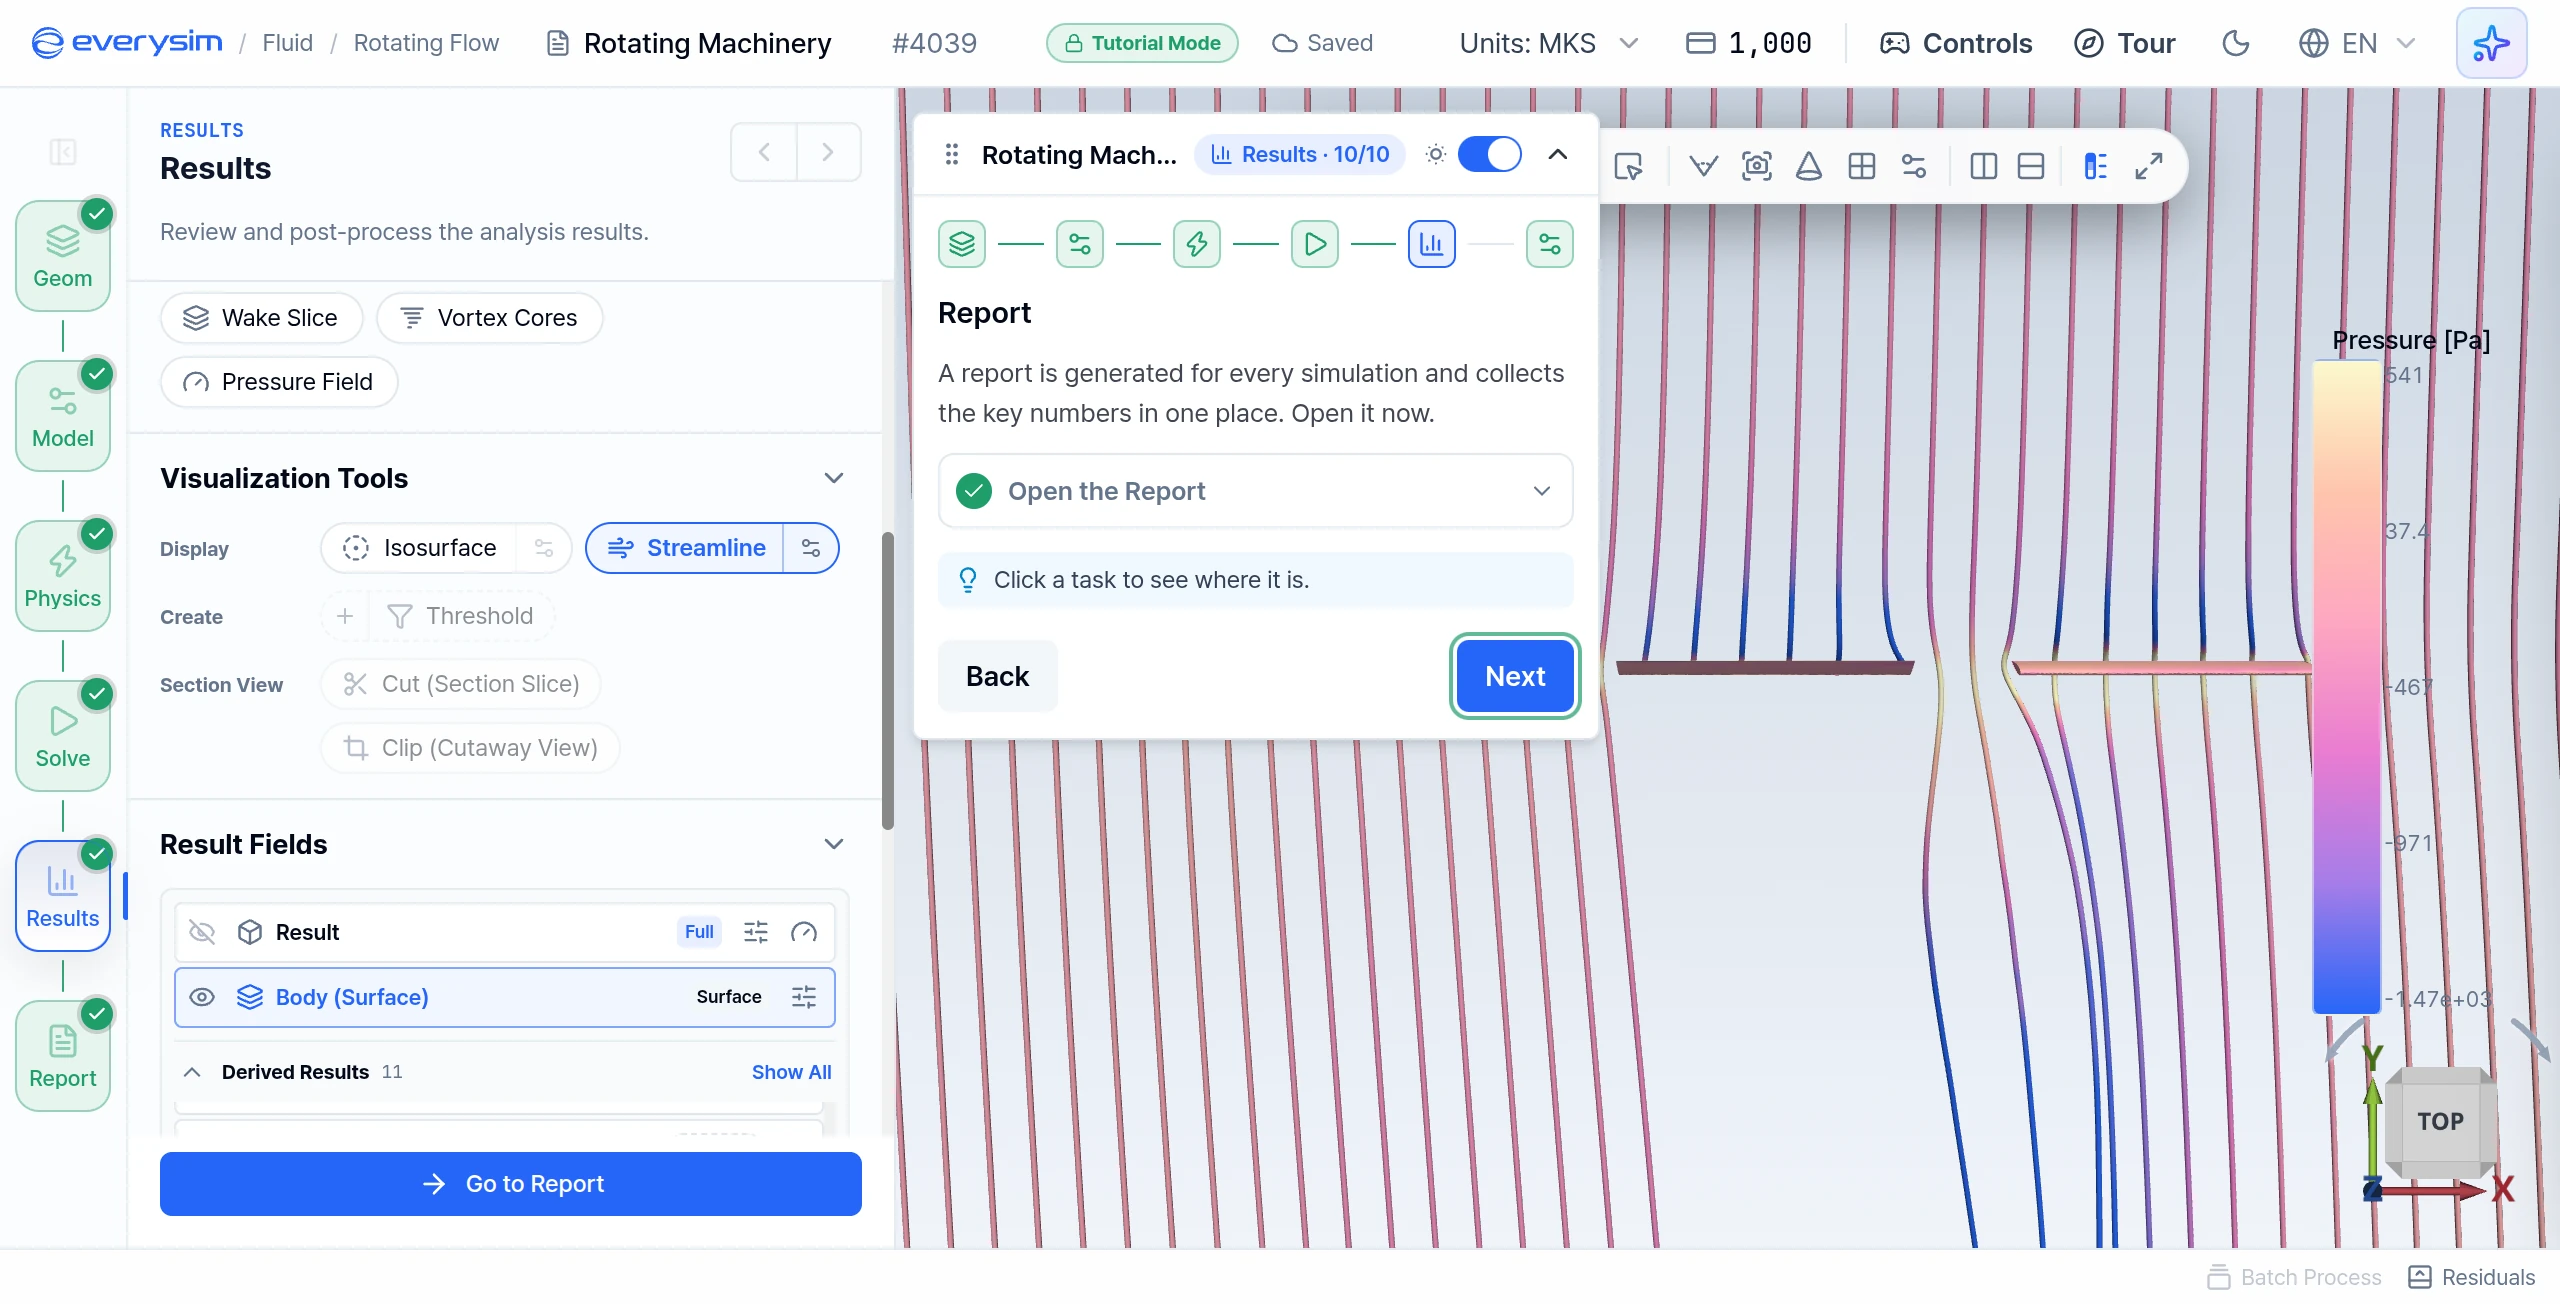
Open the Report: a report is generated for every simulation and collects the key numbers in one place. Click Go to Report at the bottom of the panel.
Report
Click Next to step through the sections. The last page has Finish instead of Next, and pressing it completes the tutorial.
Core Performance Metrics
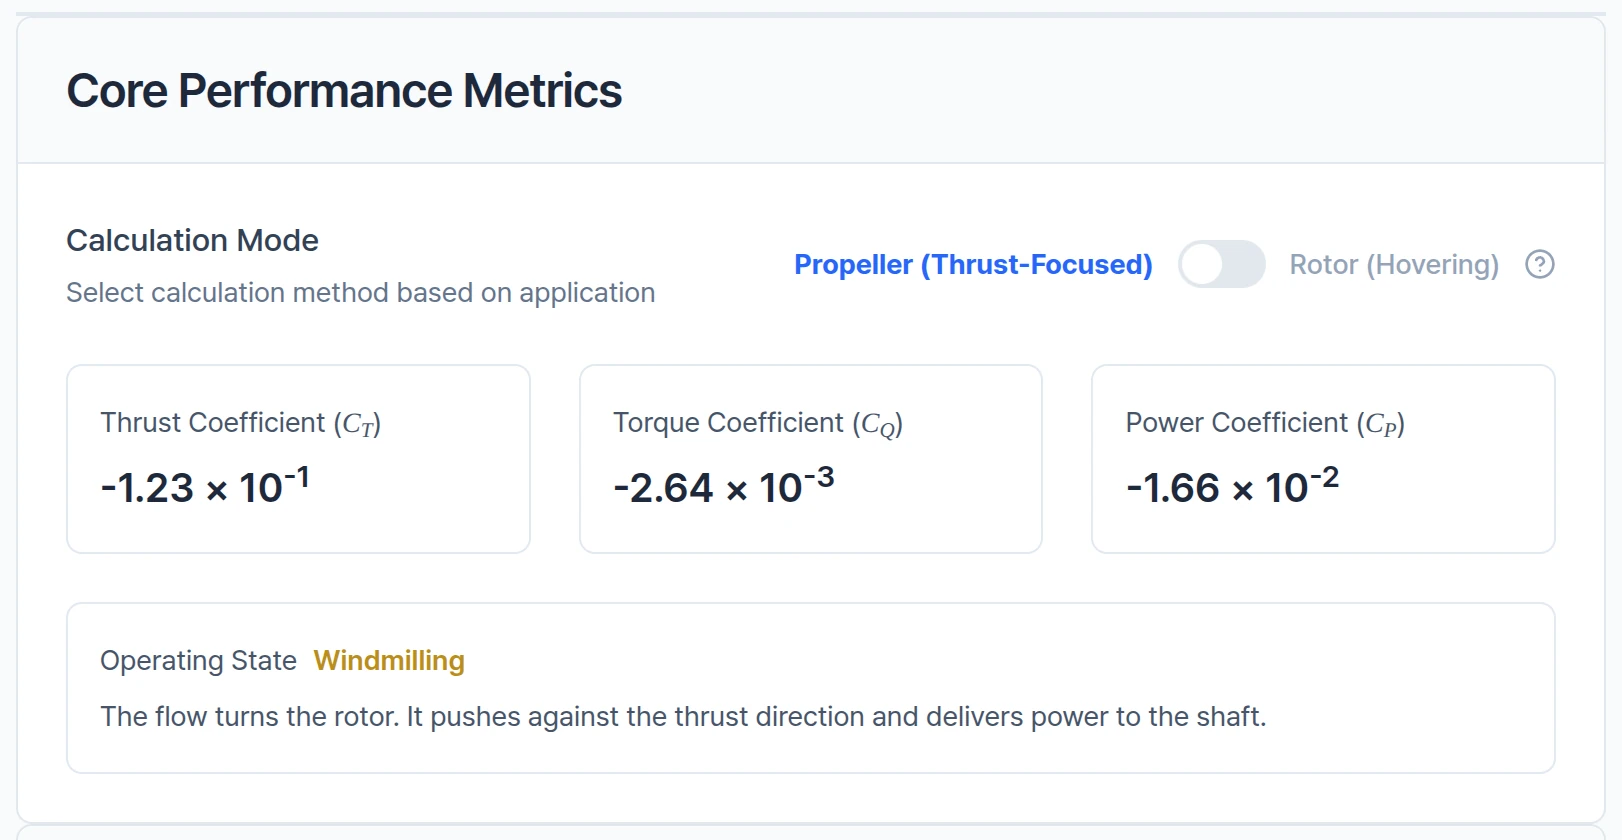
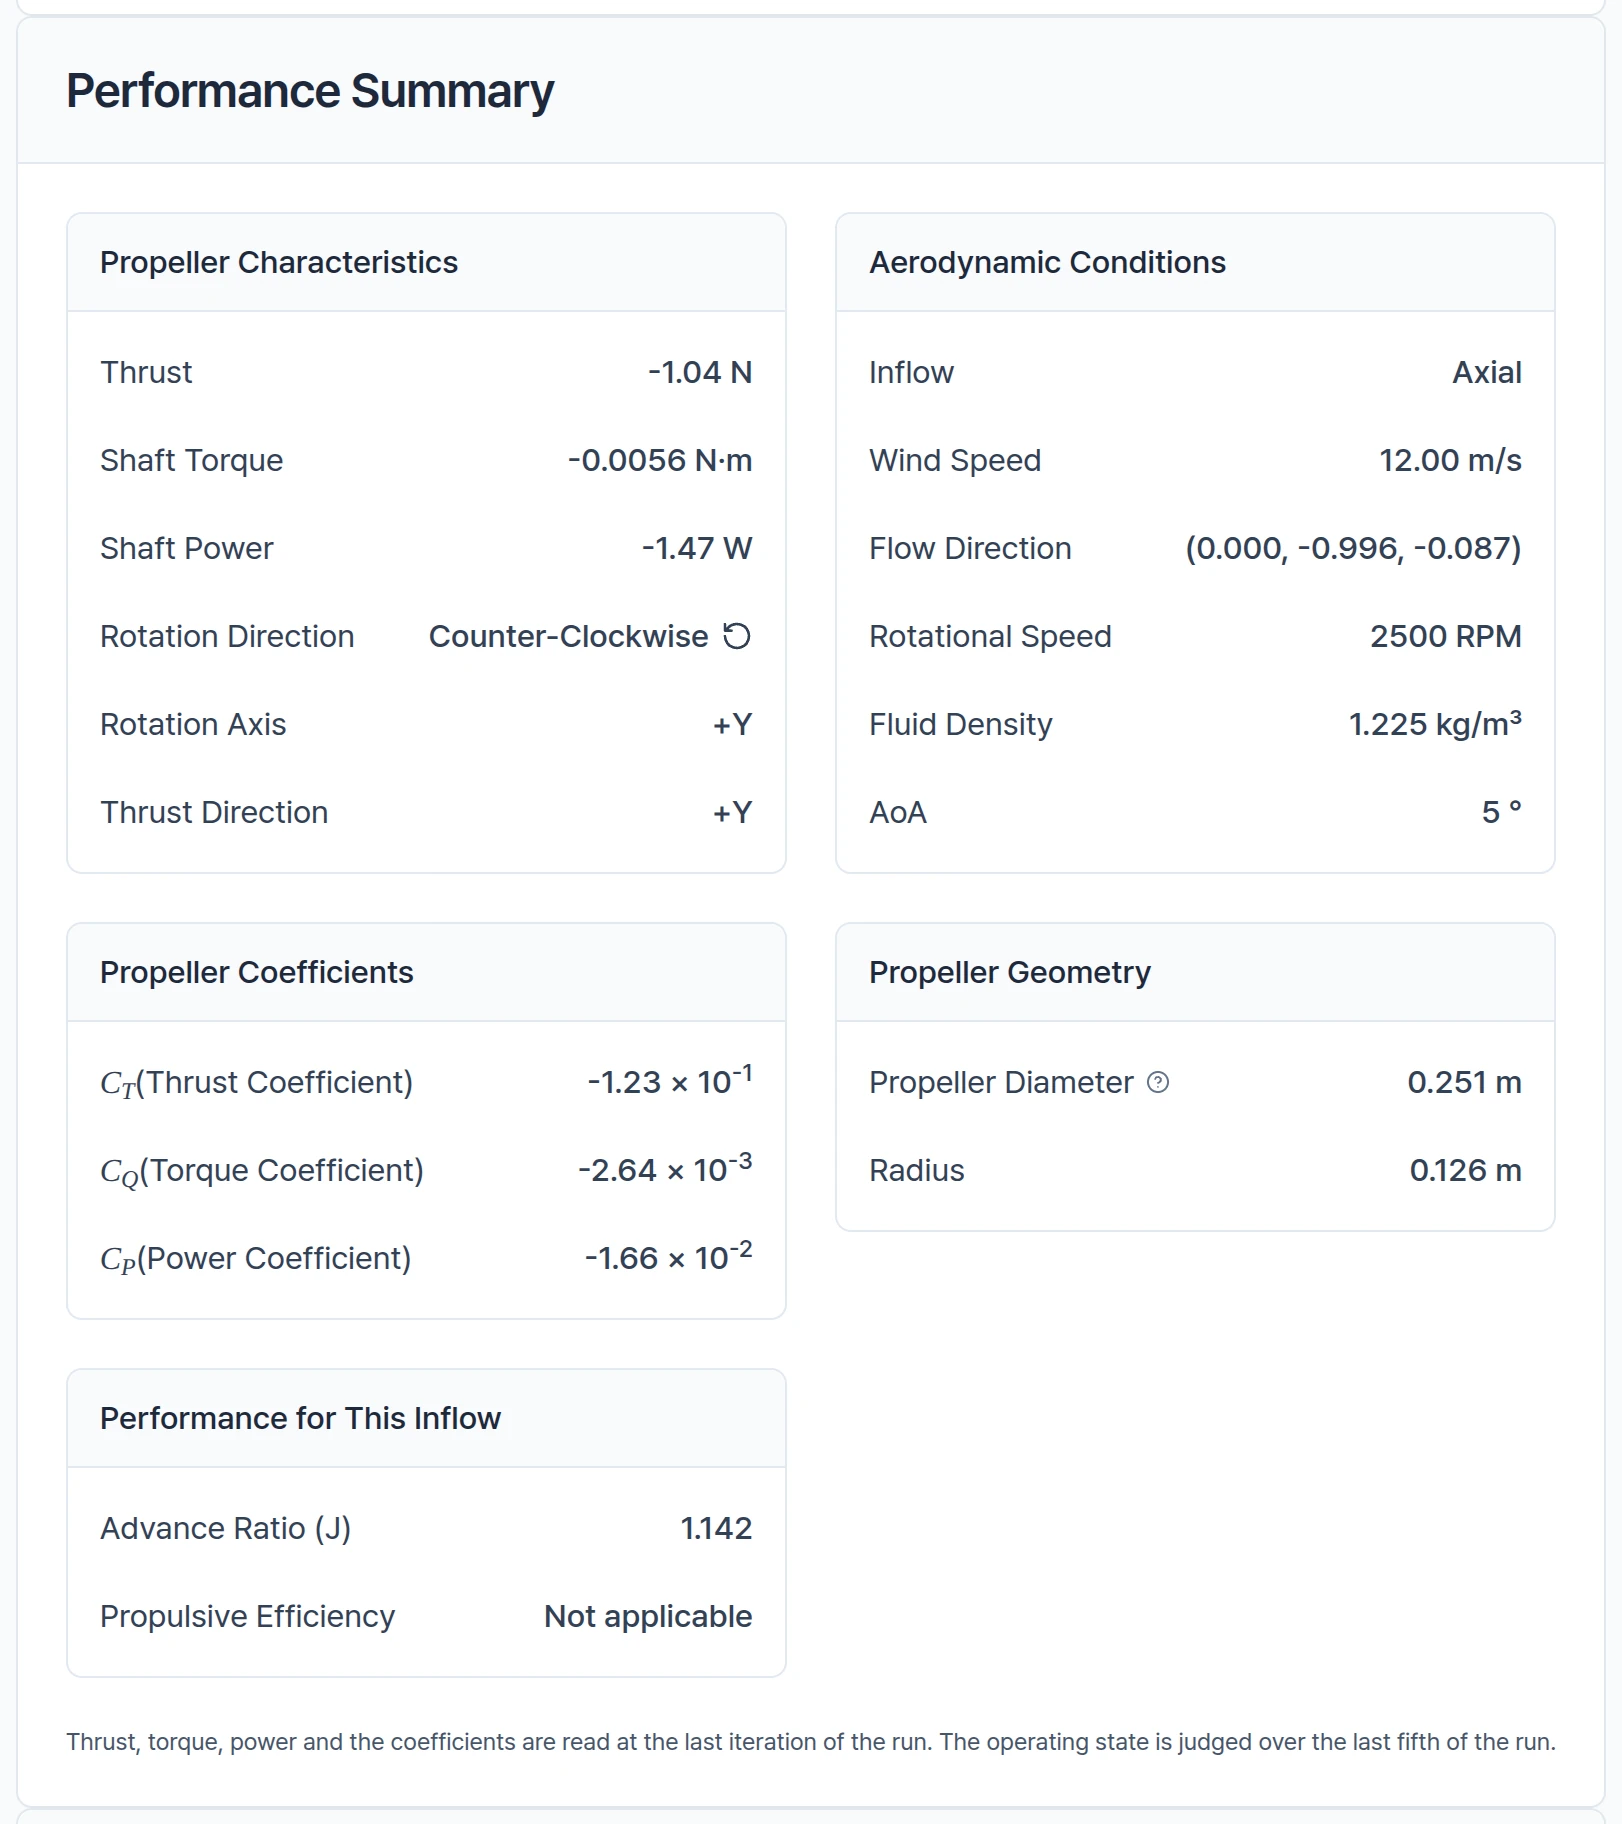
These numbers describe the propeller regardless of its size. Operating State says what the rotor is doing: pushing, braking, or being turned by the flow.
| Value | Result |
|---|---|
| Thrust Coefficient (CT) | -1.23 × 10⁻¹ |
| Torque Coefficient (CQ) | -2.64 × 10⁻³ |
| Power Coefficient (CP) | -1.66 × 10⁻² |
| Operating State | Windmilling |
In this prepared result all three coefficients are negative. The report reads Windmilling: the flow turns the rotor, pushes against the thrust direction, and delivers power to the shaft.
Performance Summary
This is the same performance in real units. Thrust is the force along the thrust direction. Shaft Torque and Shaft Power are what the motor must deliver to keep the propeller turning at this RPM, and negative values mean the shaft receives power instead.
| Value | Result |
|---|---|
| Thrust | -1.04 N |
| Shaft Torque | -0.0056 N·m |
| Shaft Power | -1.47 W |
| Rotation Direction | Counter-Clockwise |
| Rotation Axis / Thrust Direction | +Y |
| Advance Ratio (J) | 1.142 |
| Propulsive Efficiency | Not applicable |
| Wind Speed | 12.00 m/s |
| Rotational Speed | 2500 RPM |
| AoA | 5° |
| Fluid Density | 1.225 kg/m³ |
| Propeller Diameter / Radius | 0.251 m / 0.126 m |
Performance for This Inflow adds what fits the run. In forward flight that is the advance ratio and propulsive efficiency. Figure of merit appears only in hover.
Force and Moment Distribution
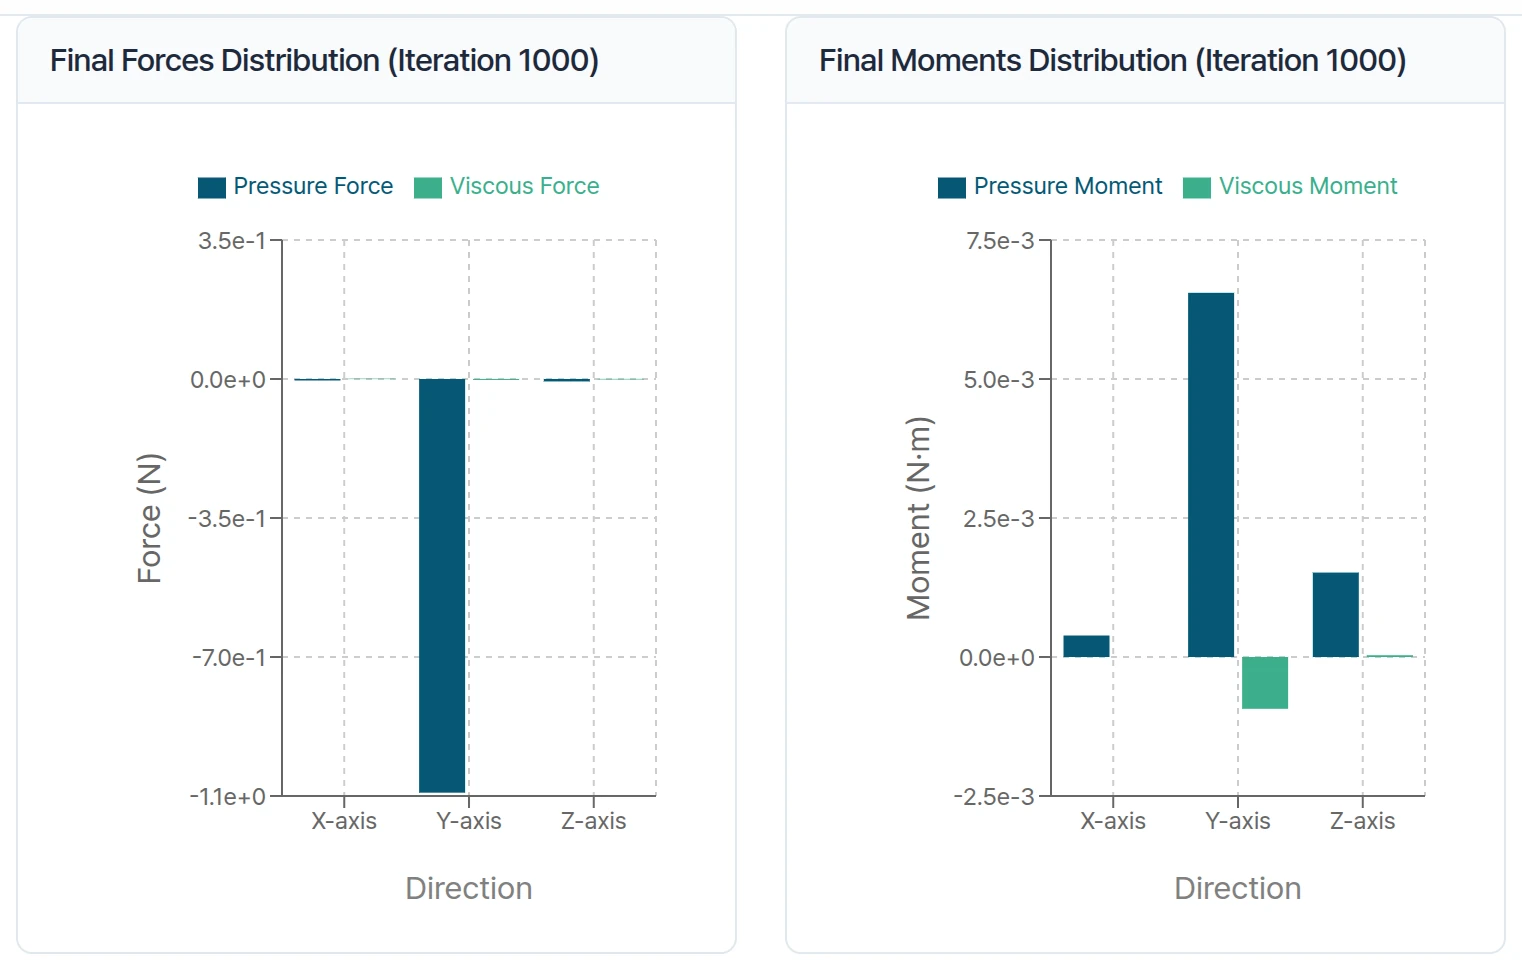
These charts show the final forces and moments on the propeller at iteration 1000. Pressure force comes from the air pushing on the blades. Viscous force comes from the air rubbing along the blades, like friction. The bar charts show in which direction each force and moment is highest.
Convergence Graph
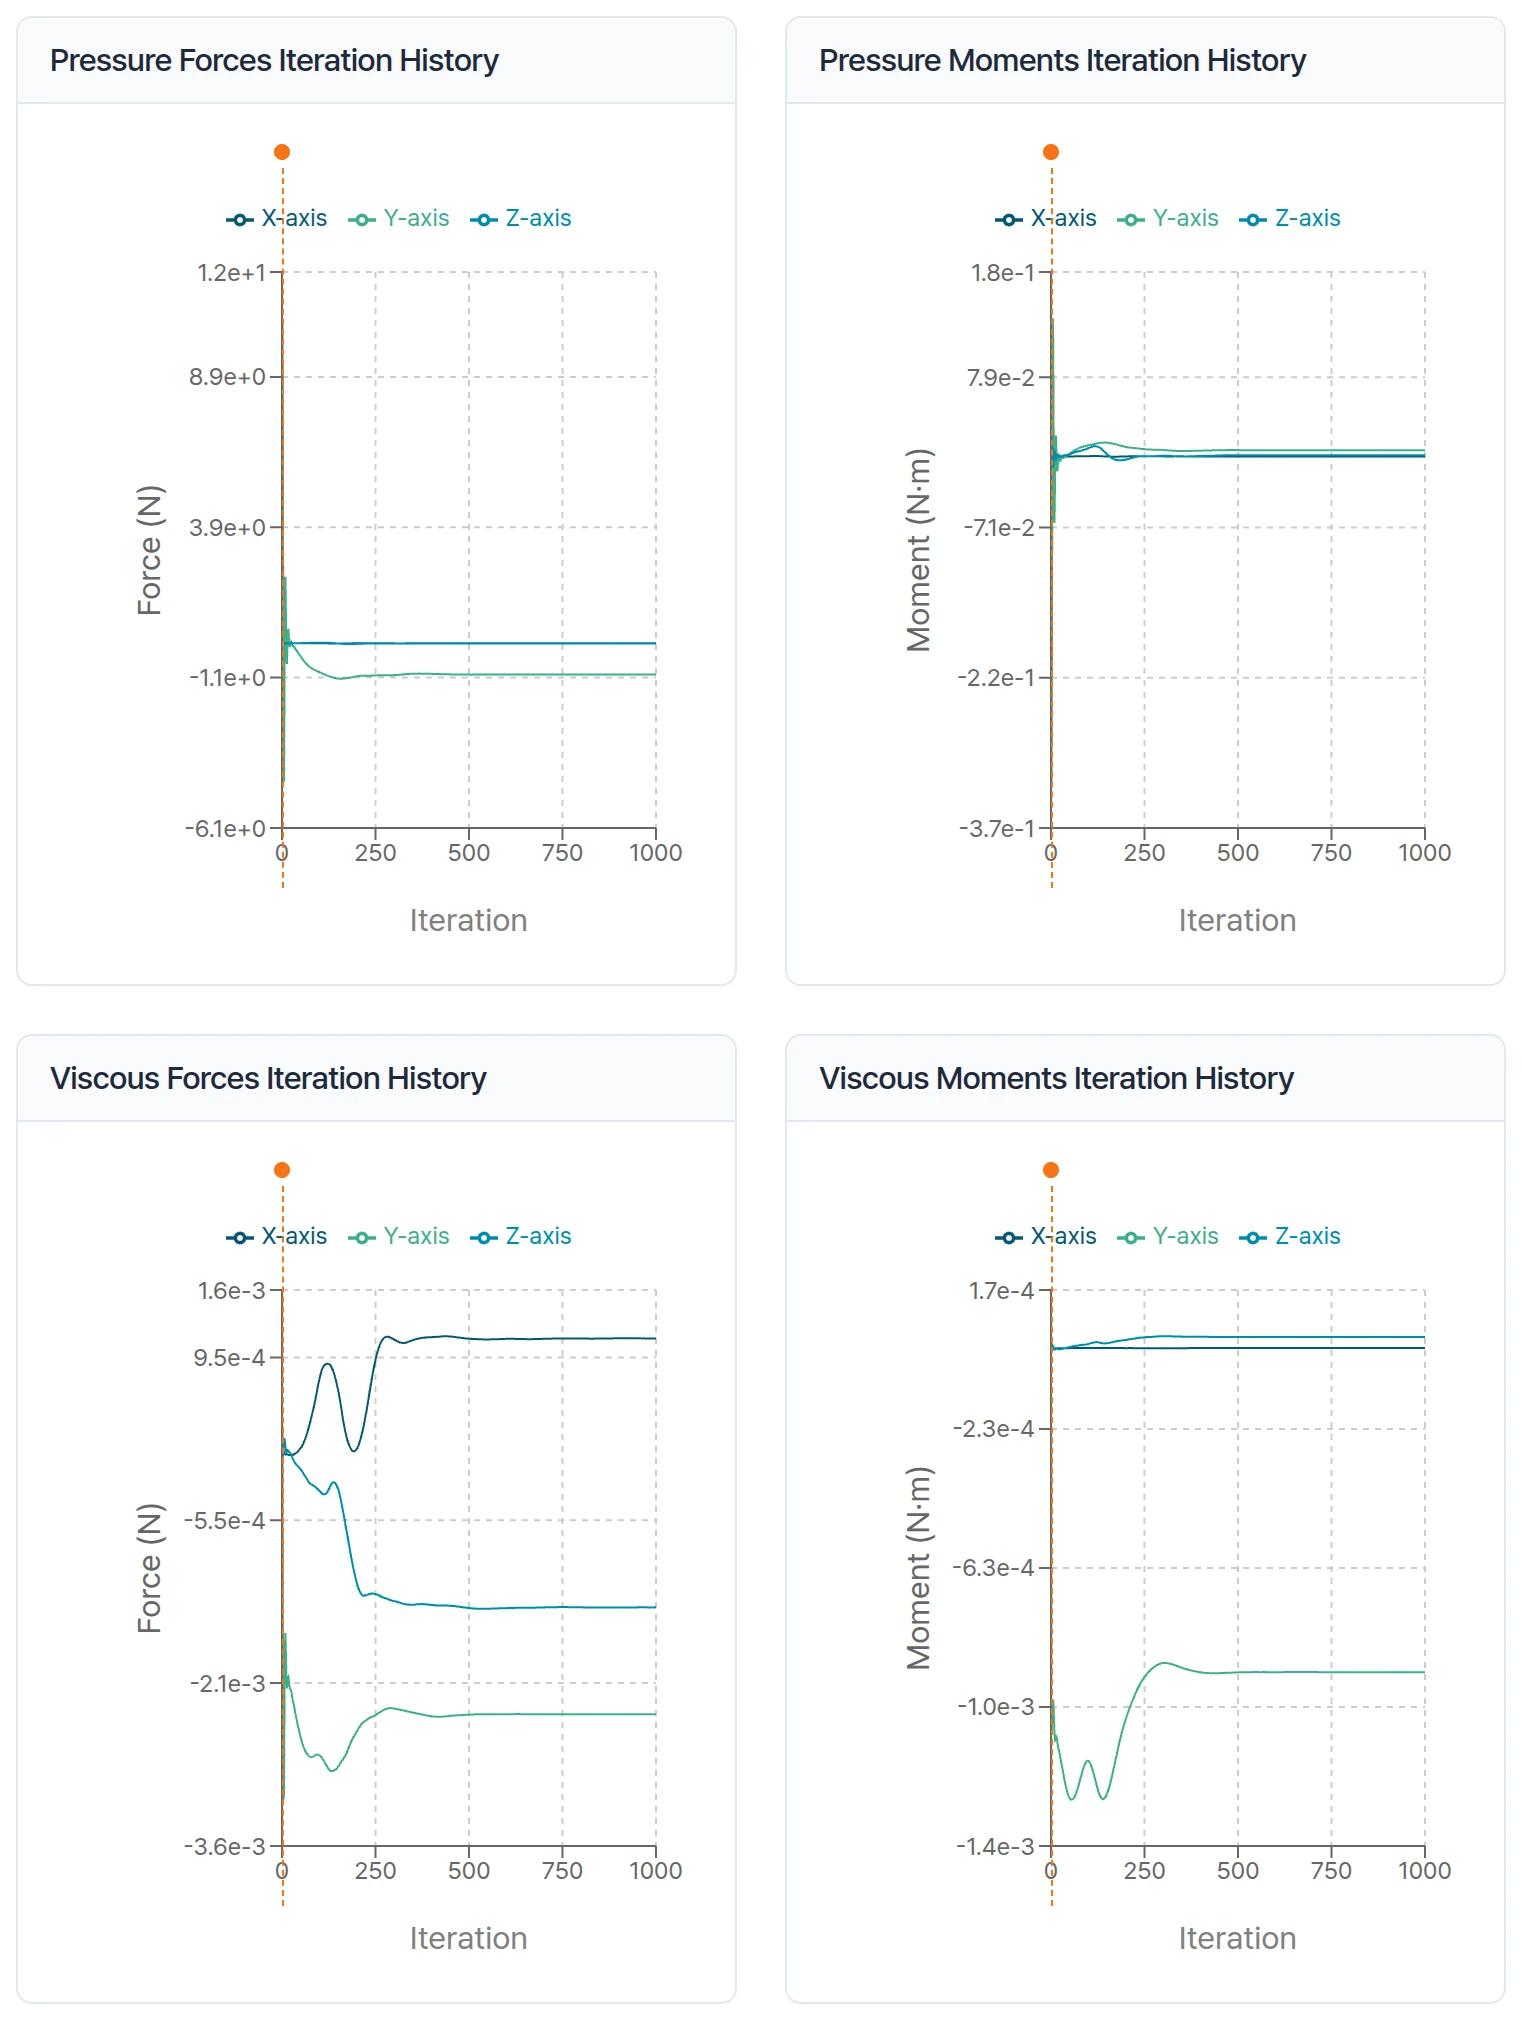
These graphs show how the forces and moments changed while the simulation ran. The values move a lot at the start, and in a good simulation they settle so the lines become almost flat, as they do here.
Press Finish to complete the tutorial.
Need Assistance or Have Questions?
Frequently Asked Questions: FAQ Link
Support Inquiries: support@everysim.io