Modal Analysis
This tutorial finds out how an airframe naturally vibrates. You assign titanium to a prepared sample airframe, analyze it as Free-Free with no constraints and no loads, then read its mode shapes and report. It takes about 20 minutes.
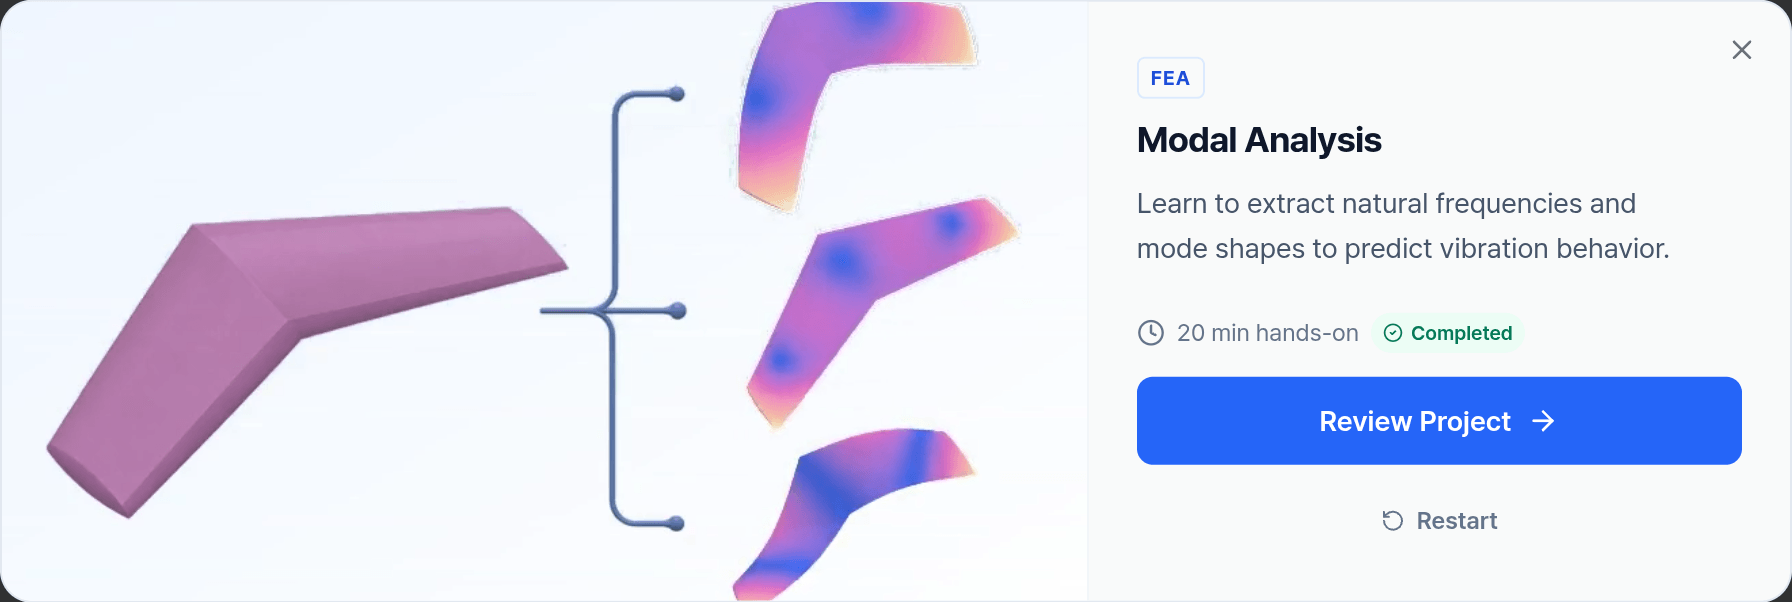
Start it from Tutorials in the dashboard. A guide card leads you through each page. Only the control a task highlights accepts clicks, and Next unlocks once the page's tasks are ticked.
What you will learn
- Assign a material, and why natural frequencies depend on stiffness and mass.
- Set a Free-Free analysis and a maximum frequency.
- Inspect mode shapes, animate them, and compare two modes in a split view.
- Separate rigid-body modes from elastic modes.
- Read the frequency spectrum and the directionality of the elastic modes in the report.
1. Geometry Panel
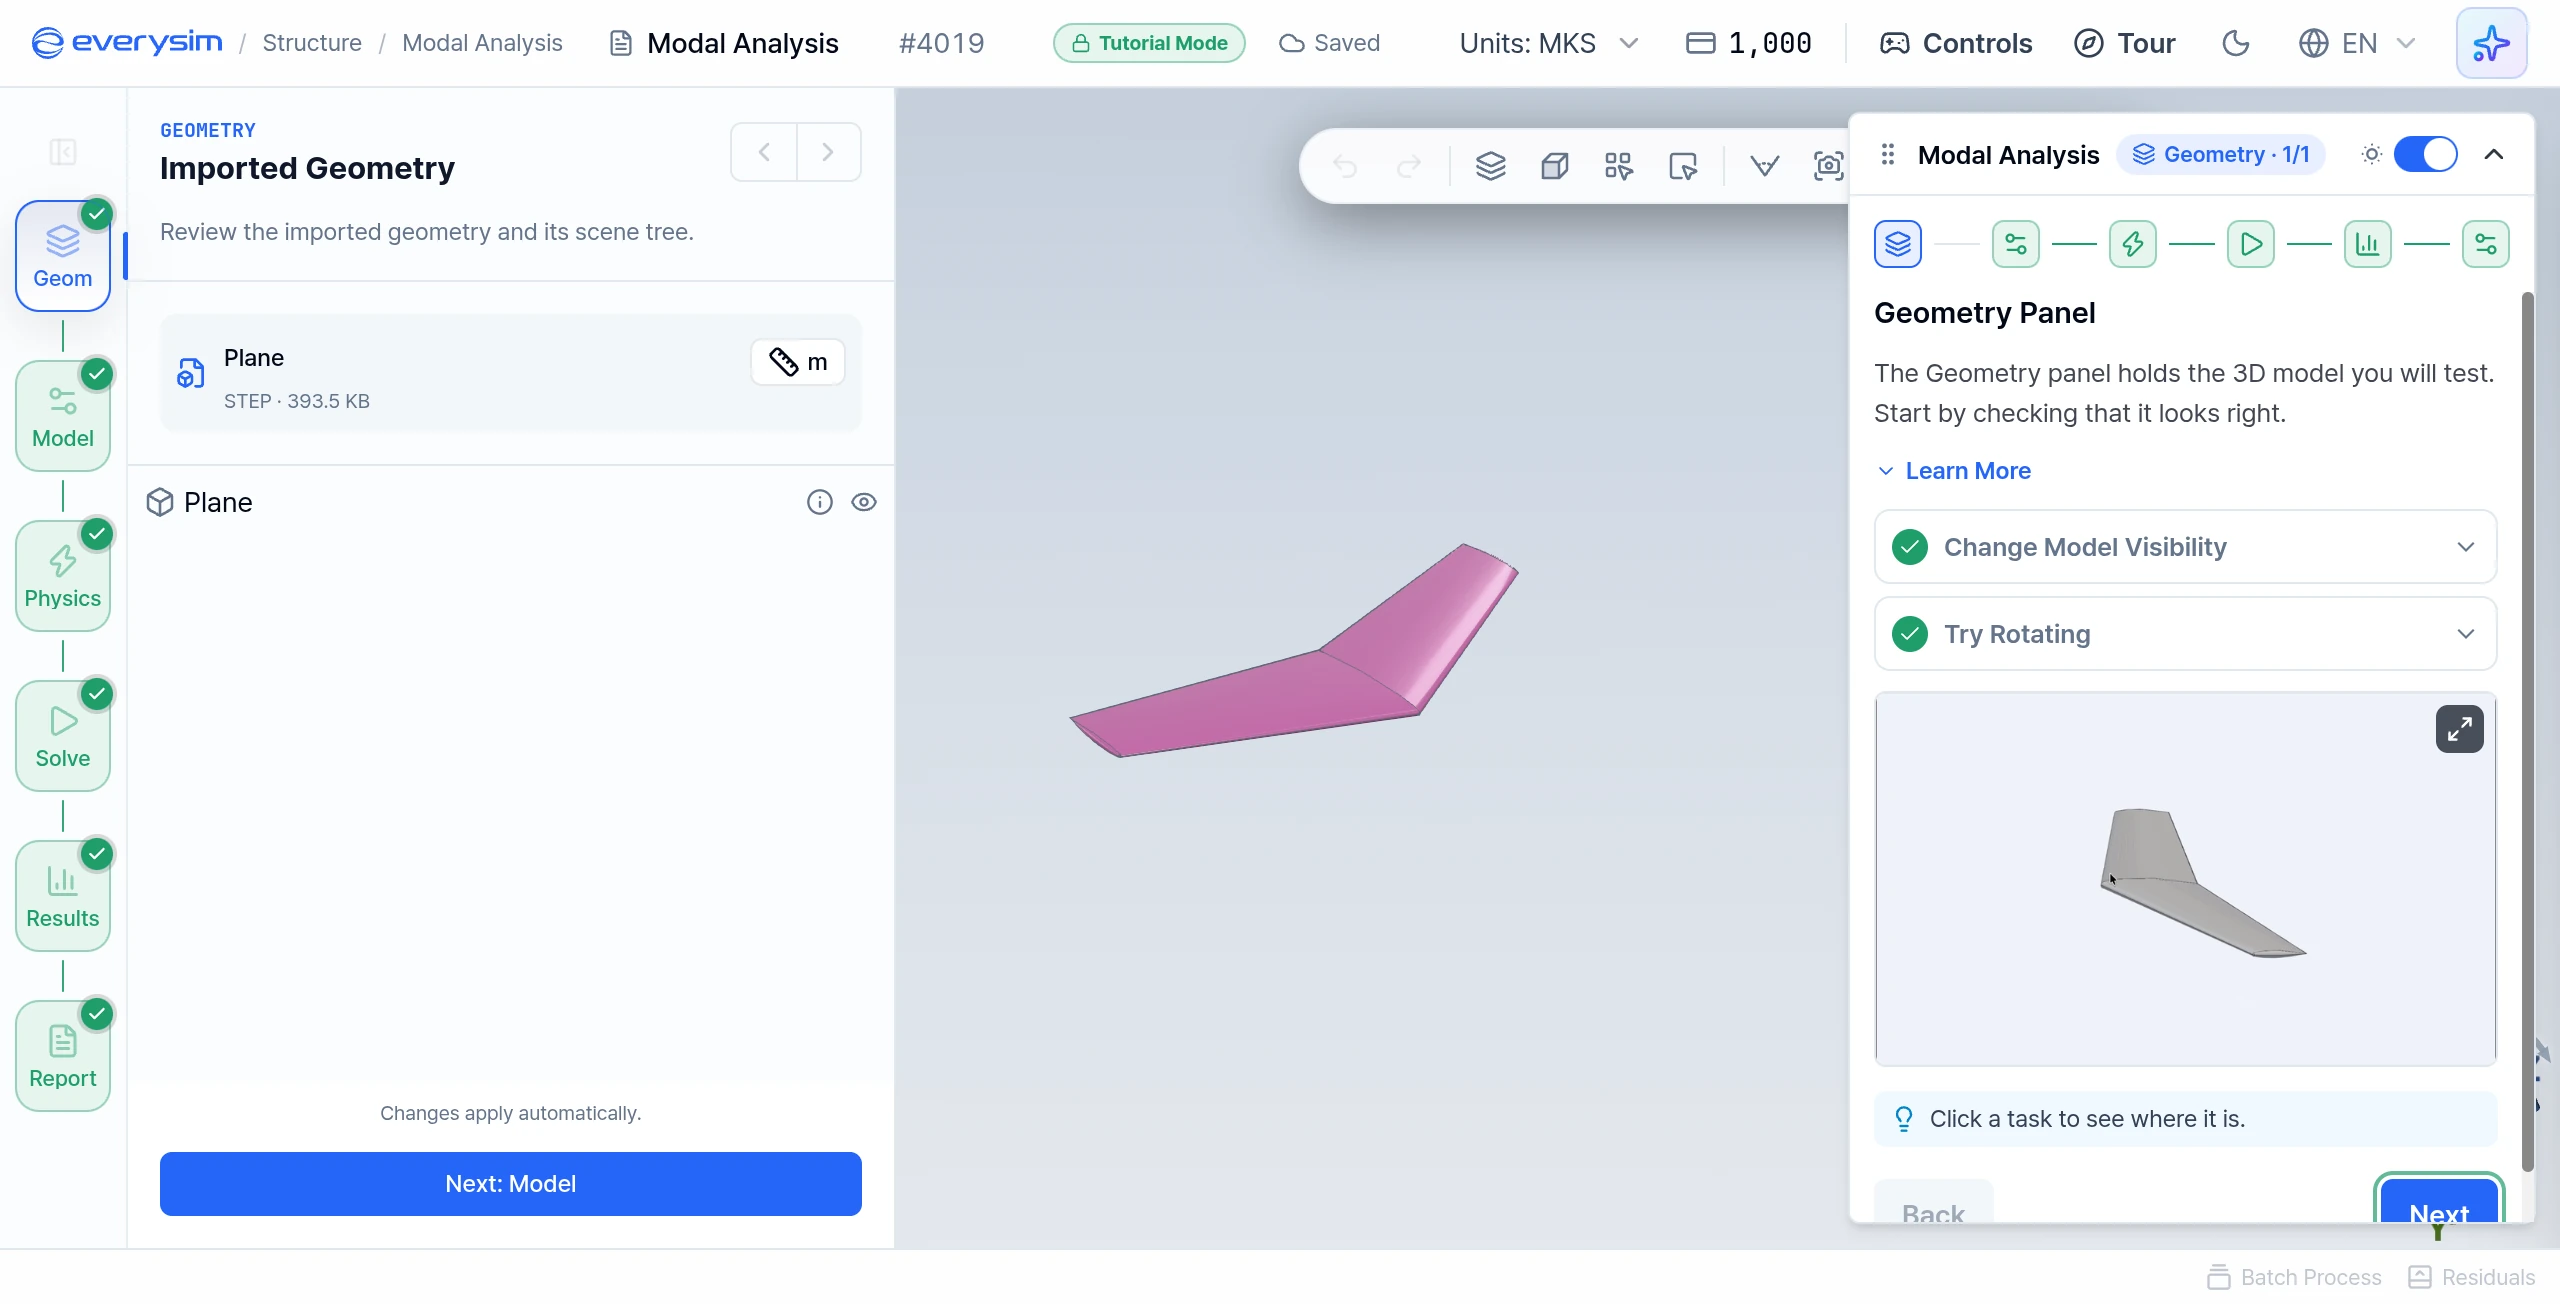
The Geometry panel holds the 3D model. The sample airframe is listed as Plane.
- Change Model Visibility: toggle the eye icon to hide the model, then show it again.
- Try Rotating: drag in the 3D viewport to rotate the model.
2. Material Properties
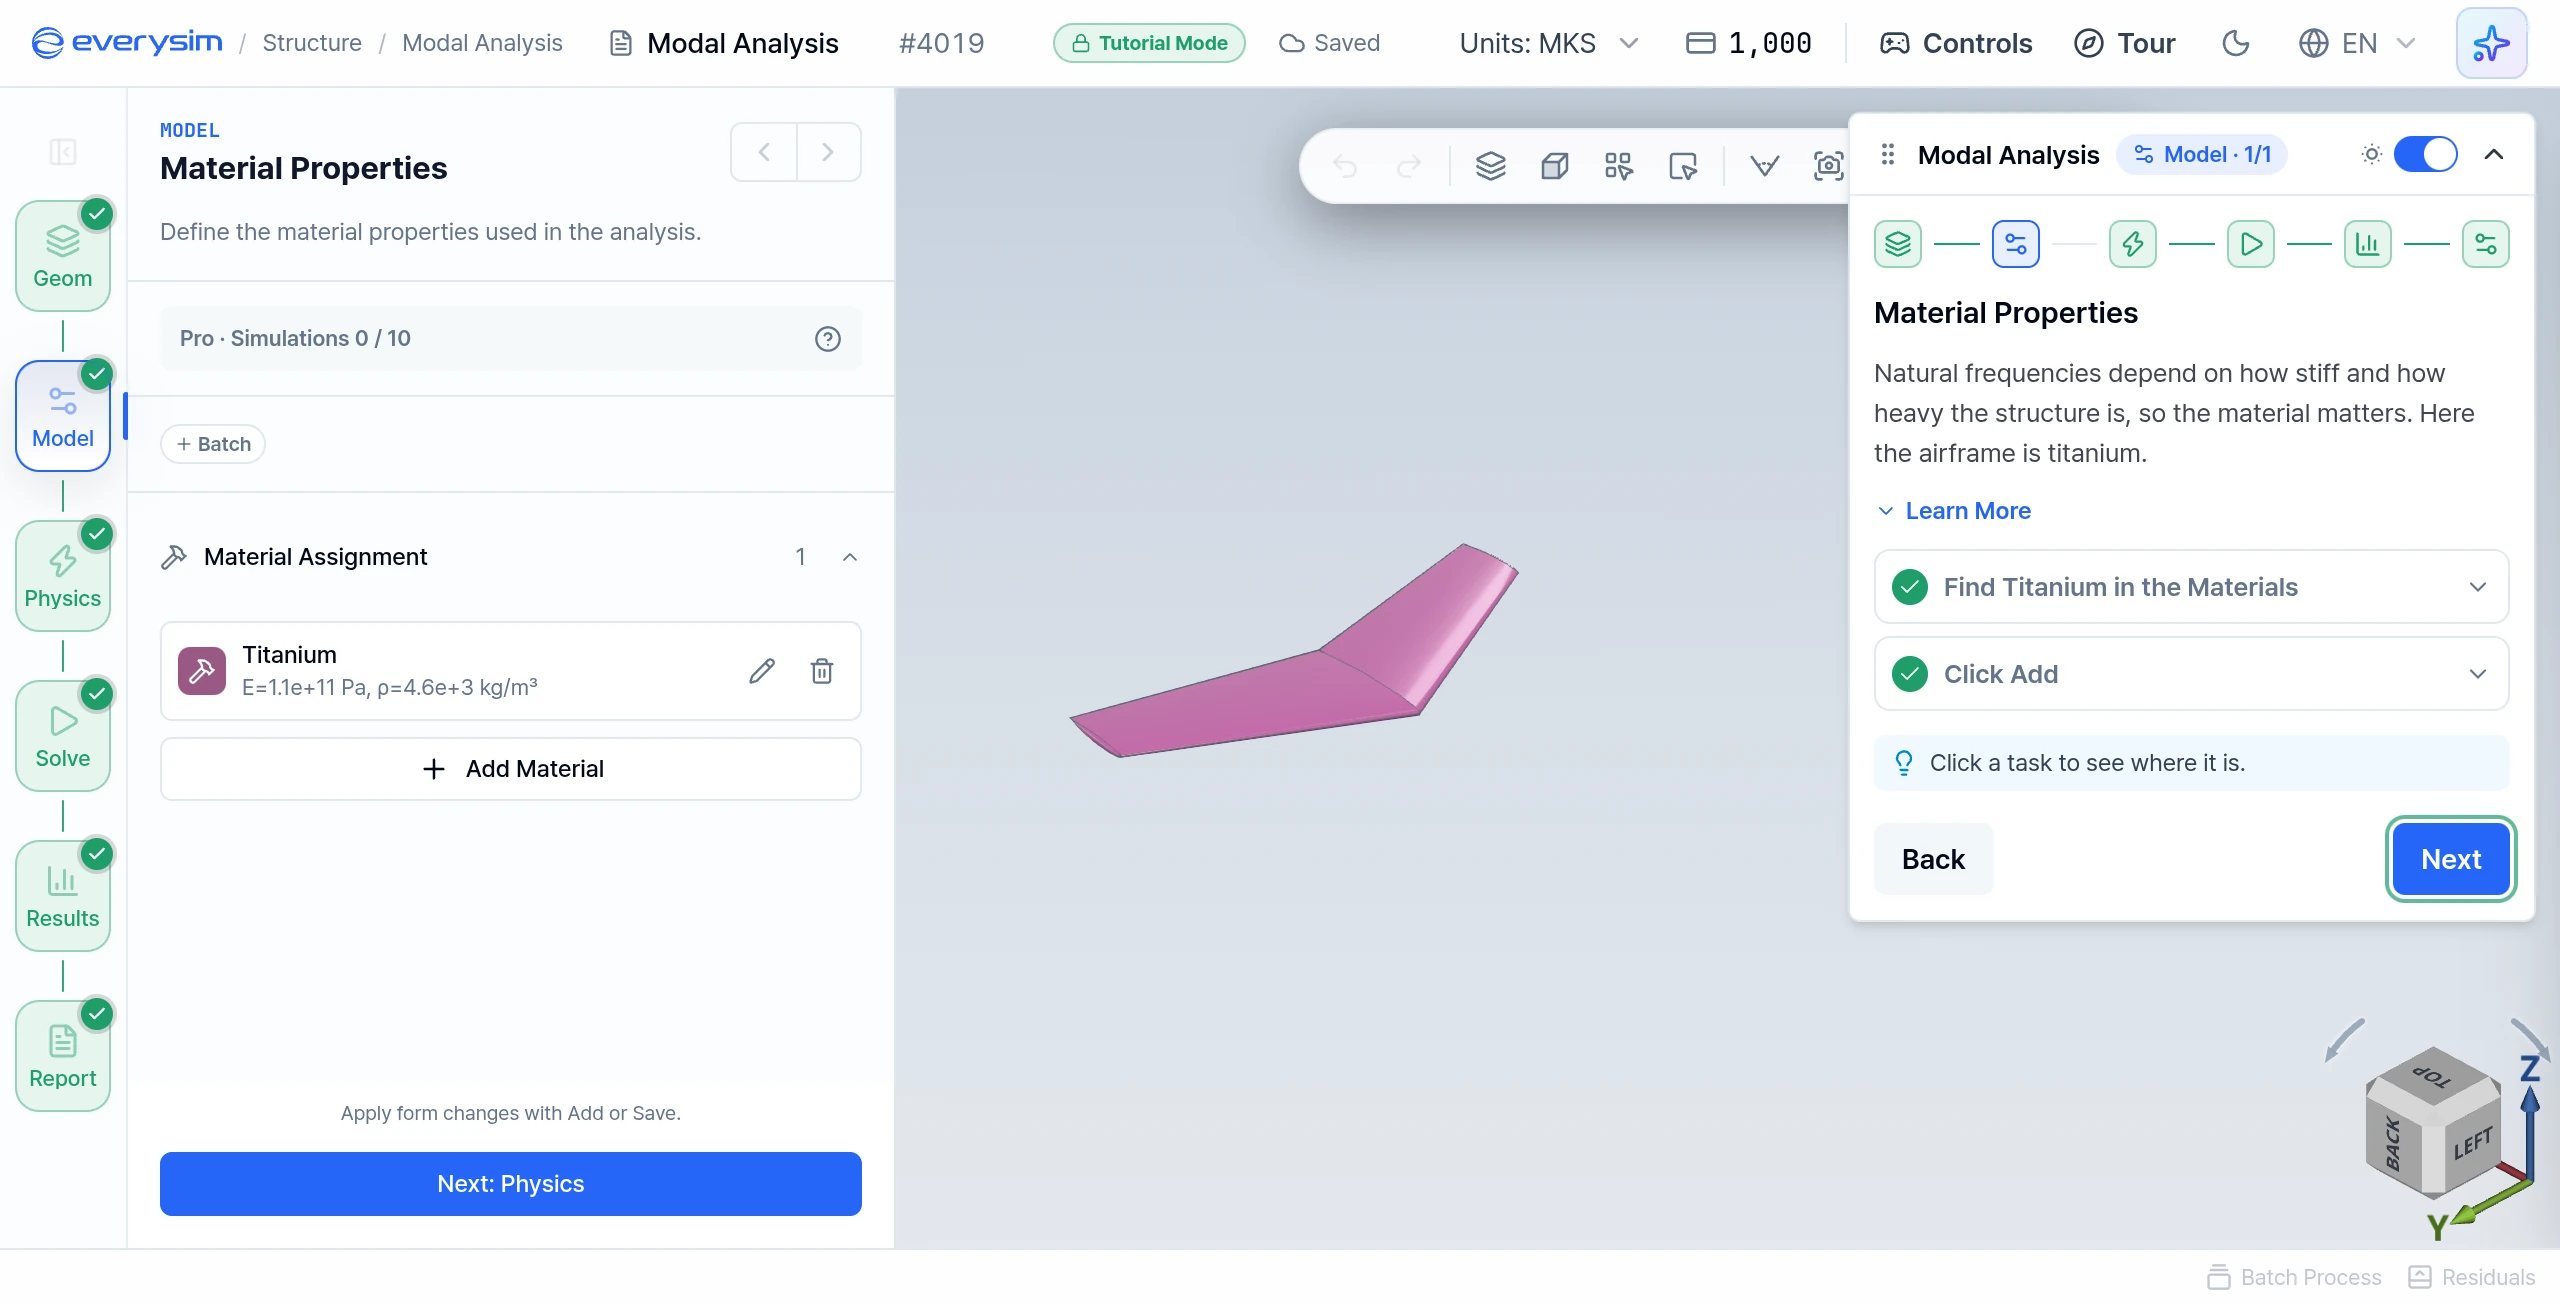
Natural frequencies depend on how stiff and how heavy the structure is, so the material matters.
- Find Titanium in the Materials: click Add Material, open Metals and then Other Metals, and choose Titanium.
- Click Add: check that the whole geometry is shown in the material colour, then click Add.
3. Physics Panel
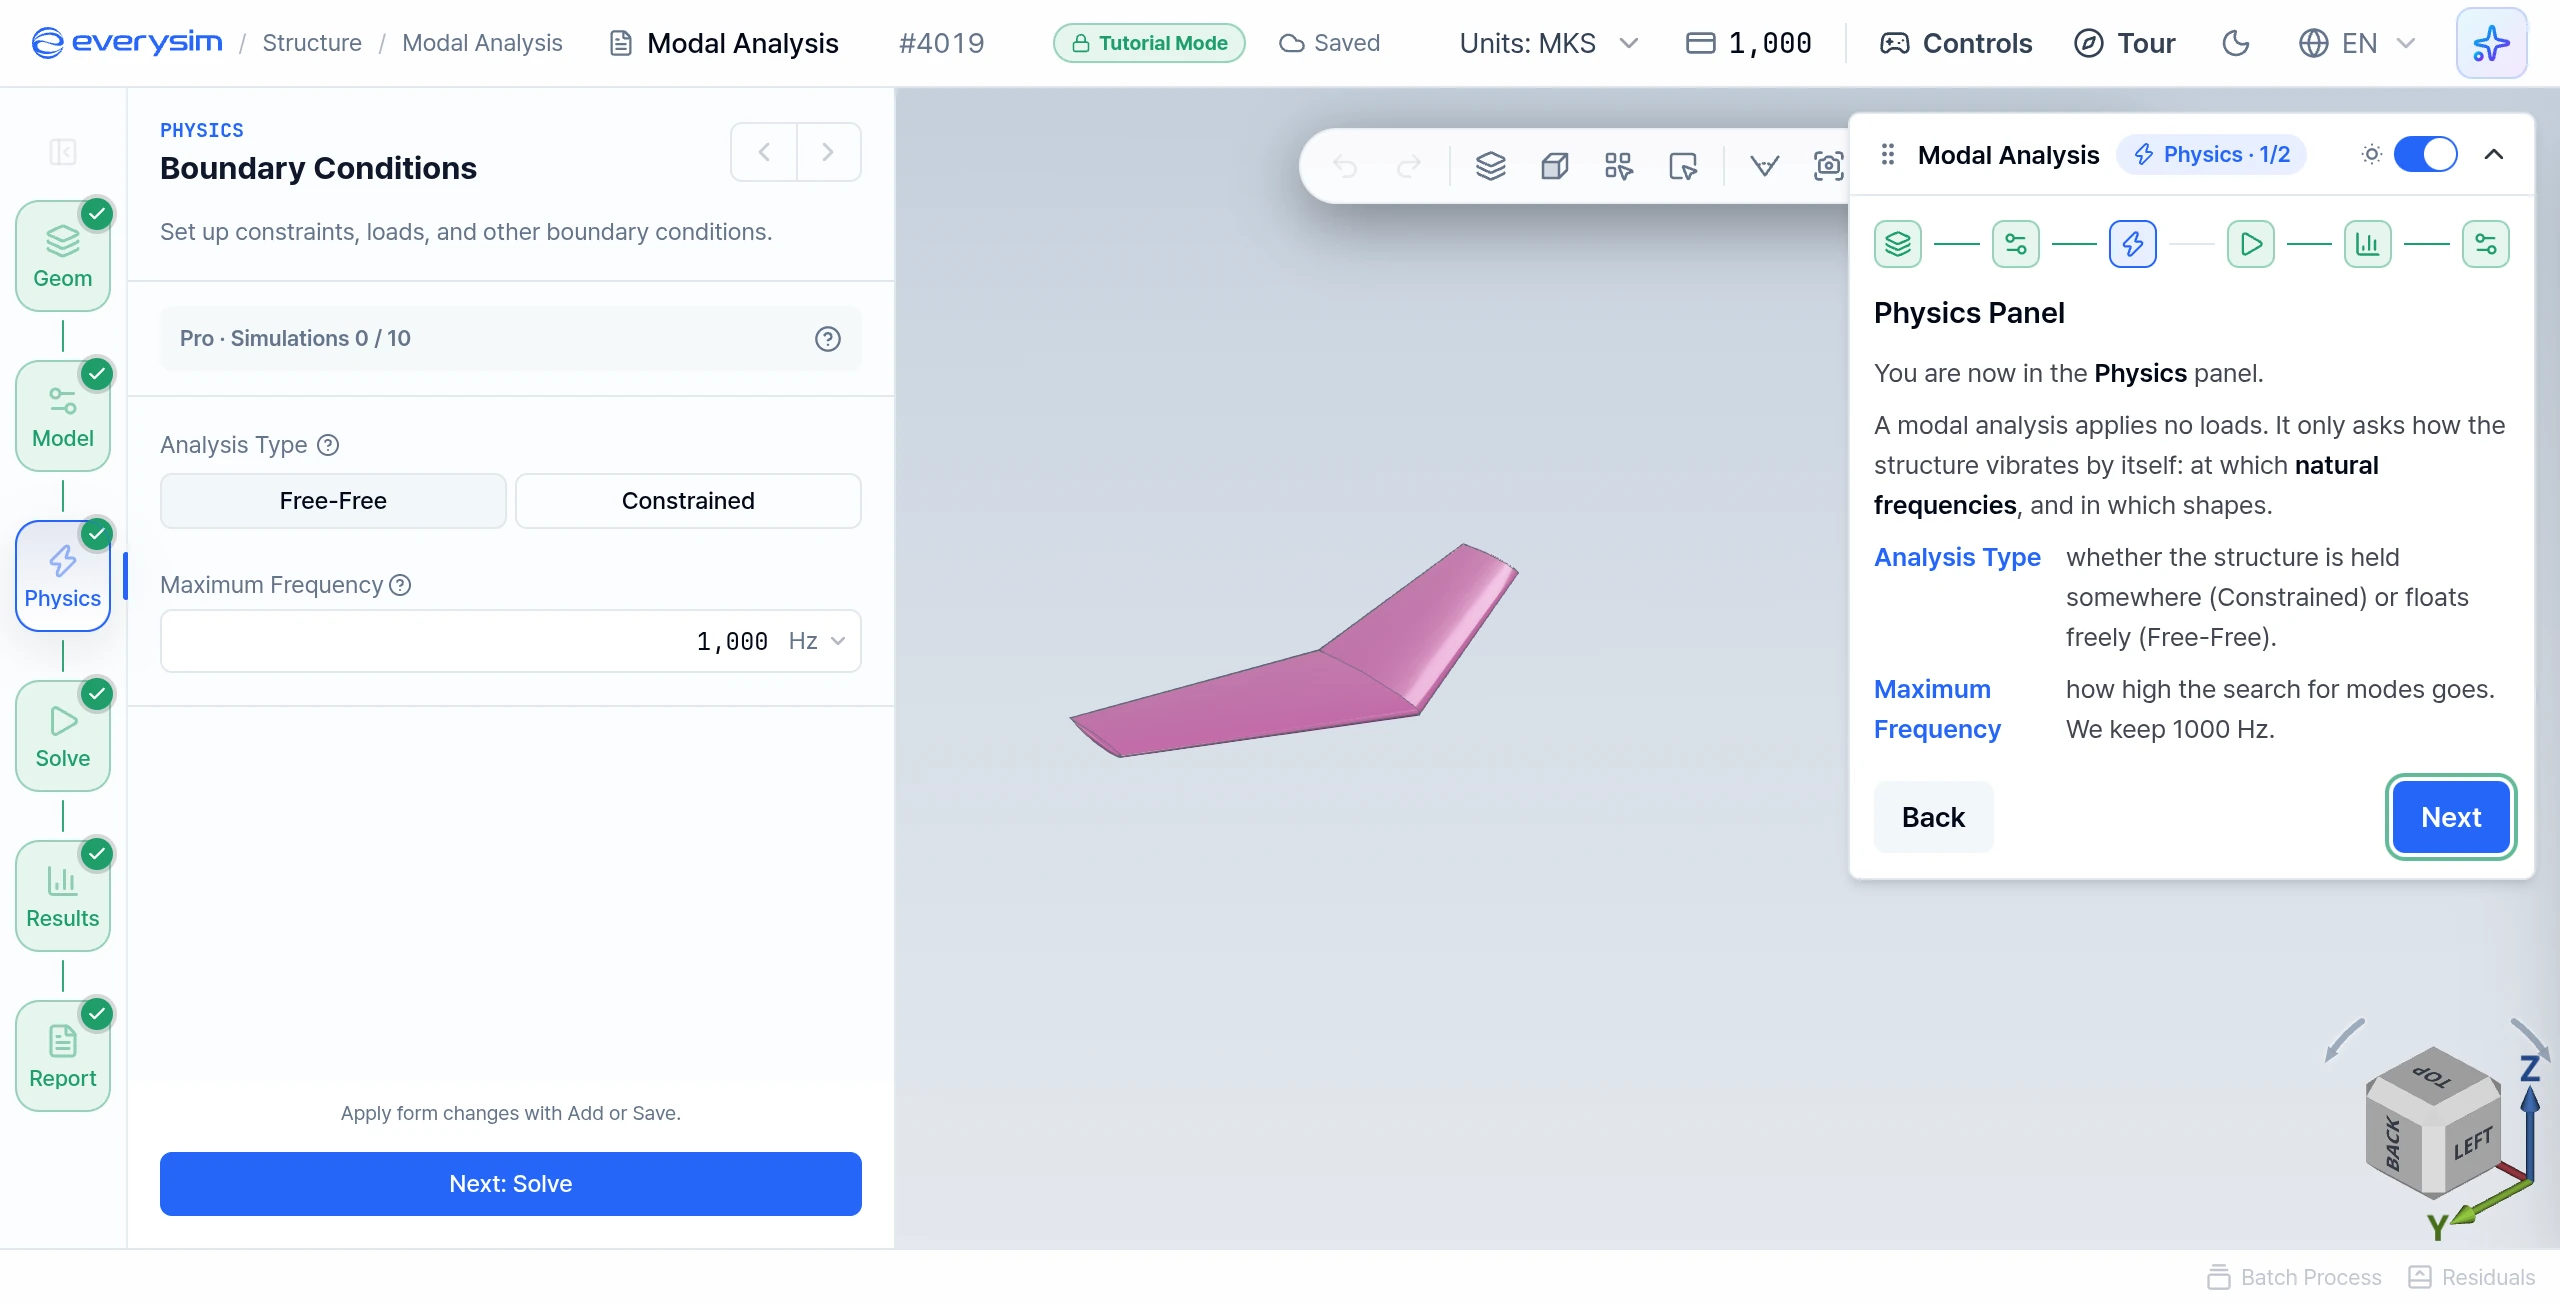
A modal analysis applies no loads. It only asks at which natural frequencies and in which shapes the structure vibrates by itself. This page has no task.
- Analysis Type: whether the structure is held somewhere (Constrained) or floats freely (Free-Free).
- Maximum Frequency: how high the search for modes goes. Keep
1000 Hz.
4. Analysis Type
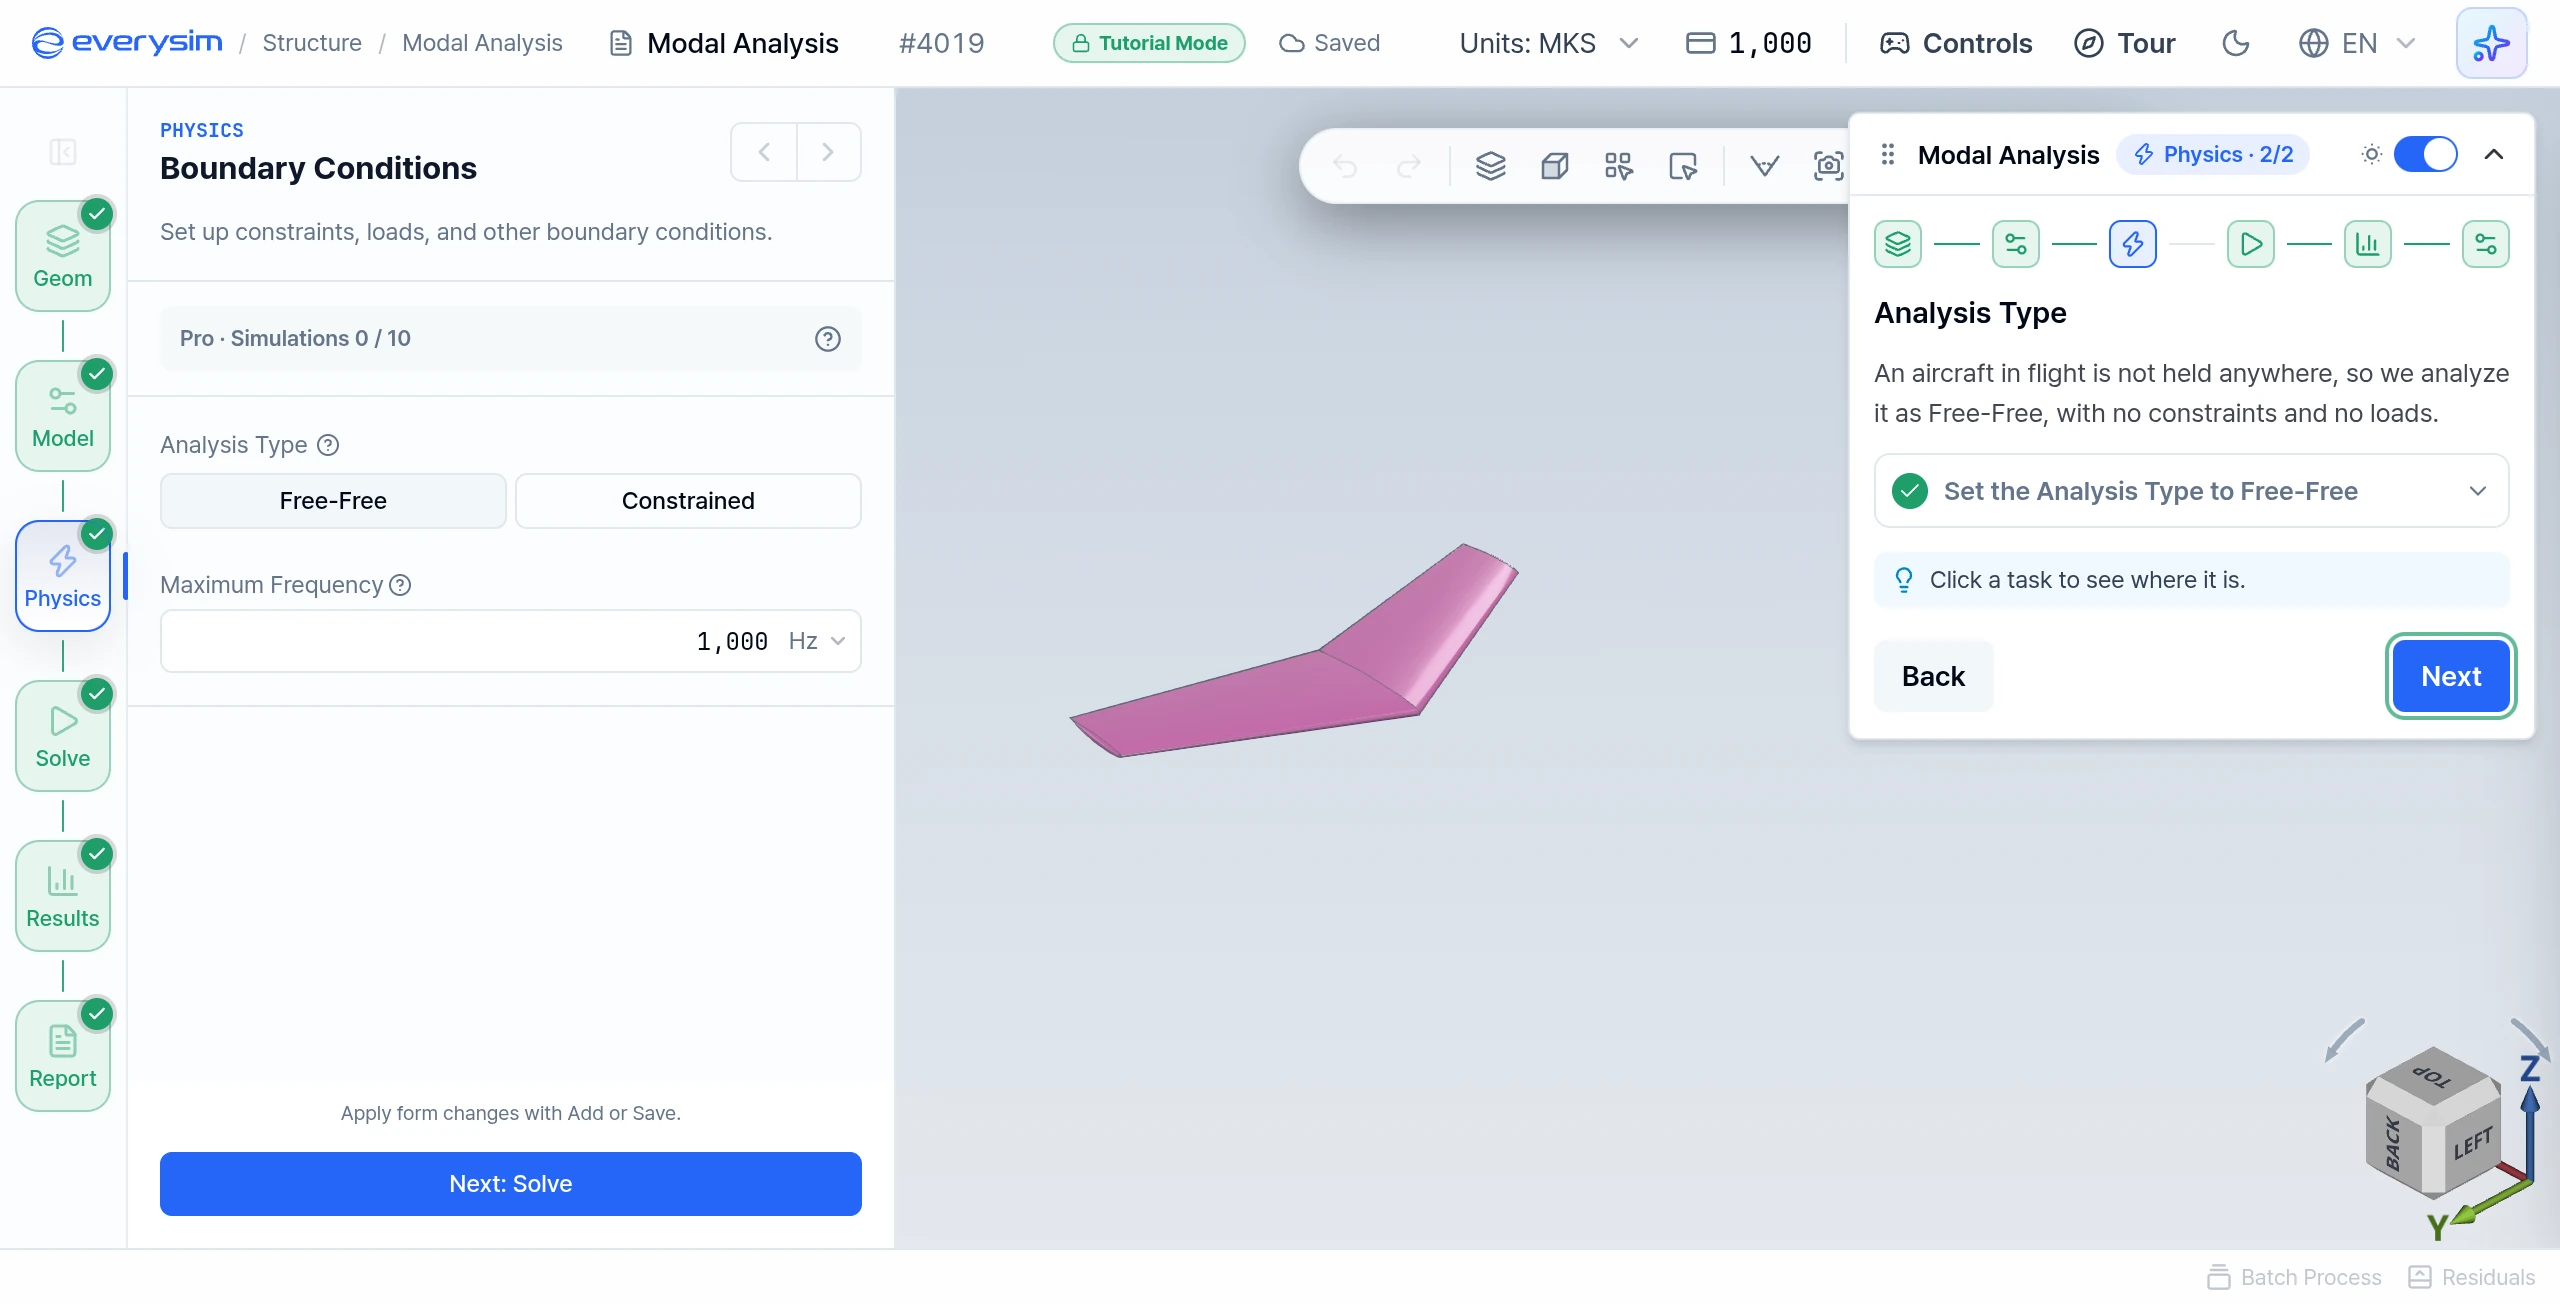
An aircraft in flight is not held anywhere, so it is analyzed with no constraints and no loads.
- Set the Analysis Type to Free-Free: click Free-Free under Analysis Type.
5. Solve Settings
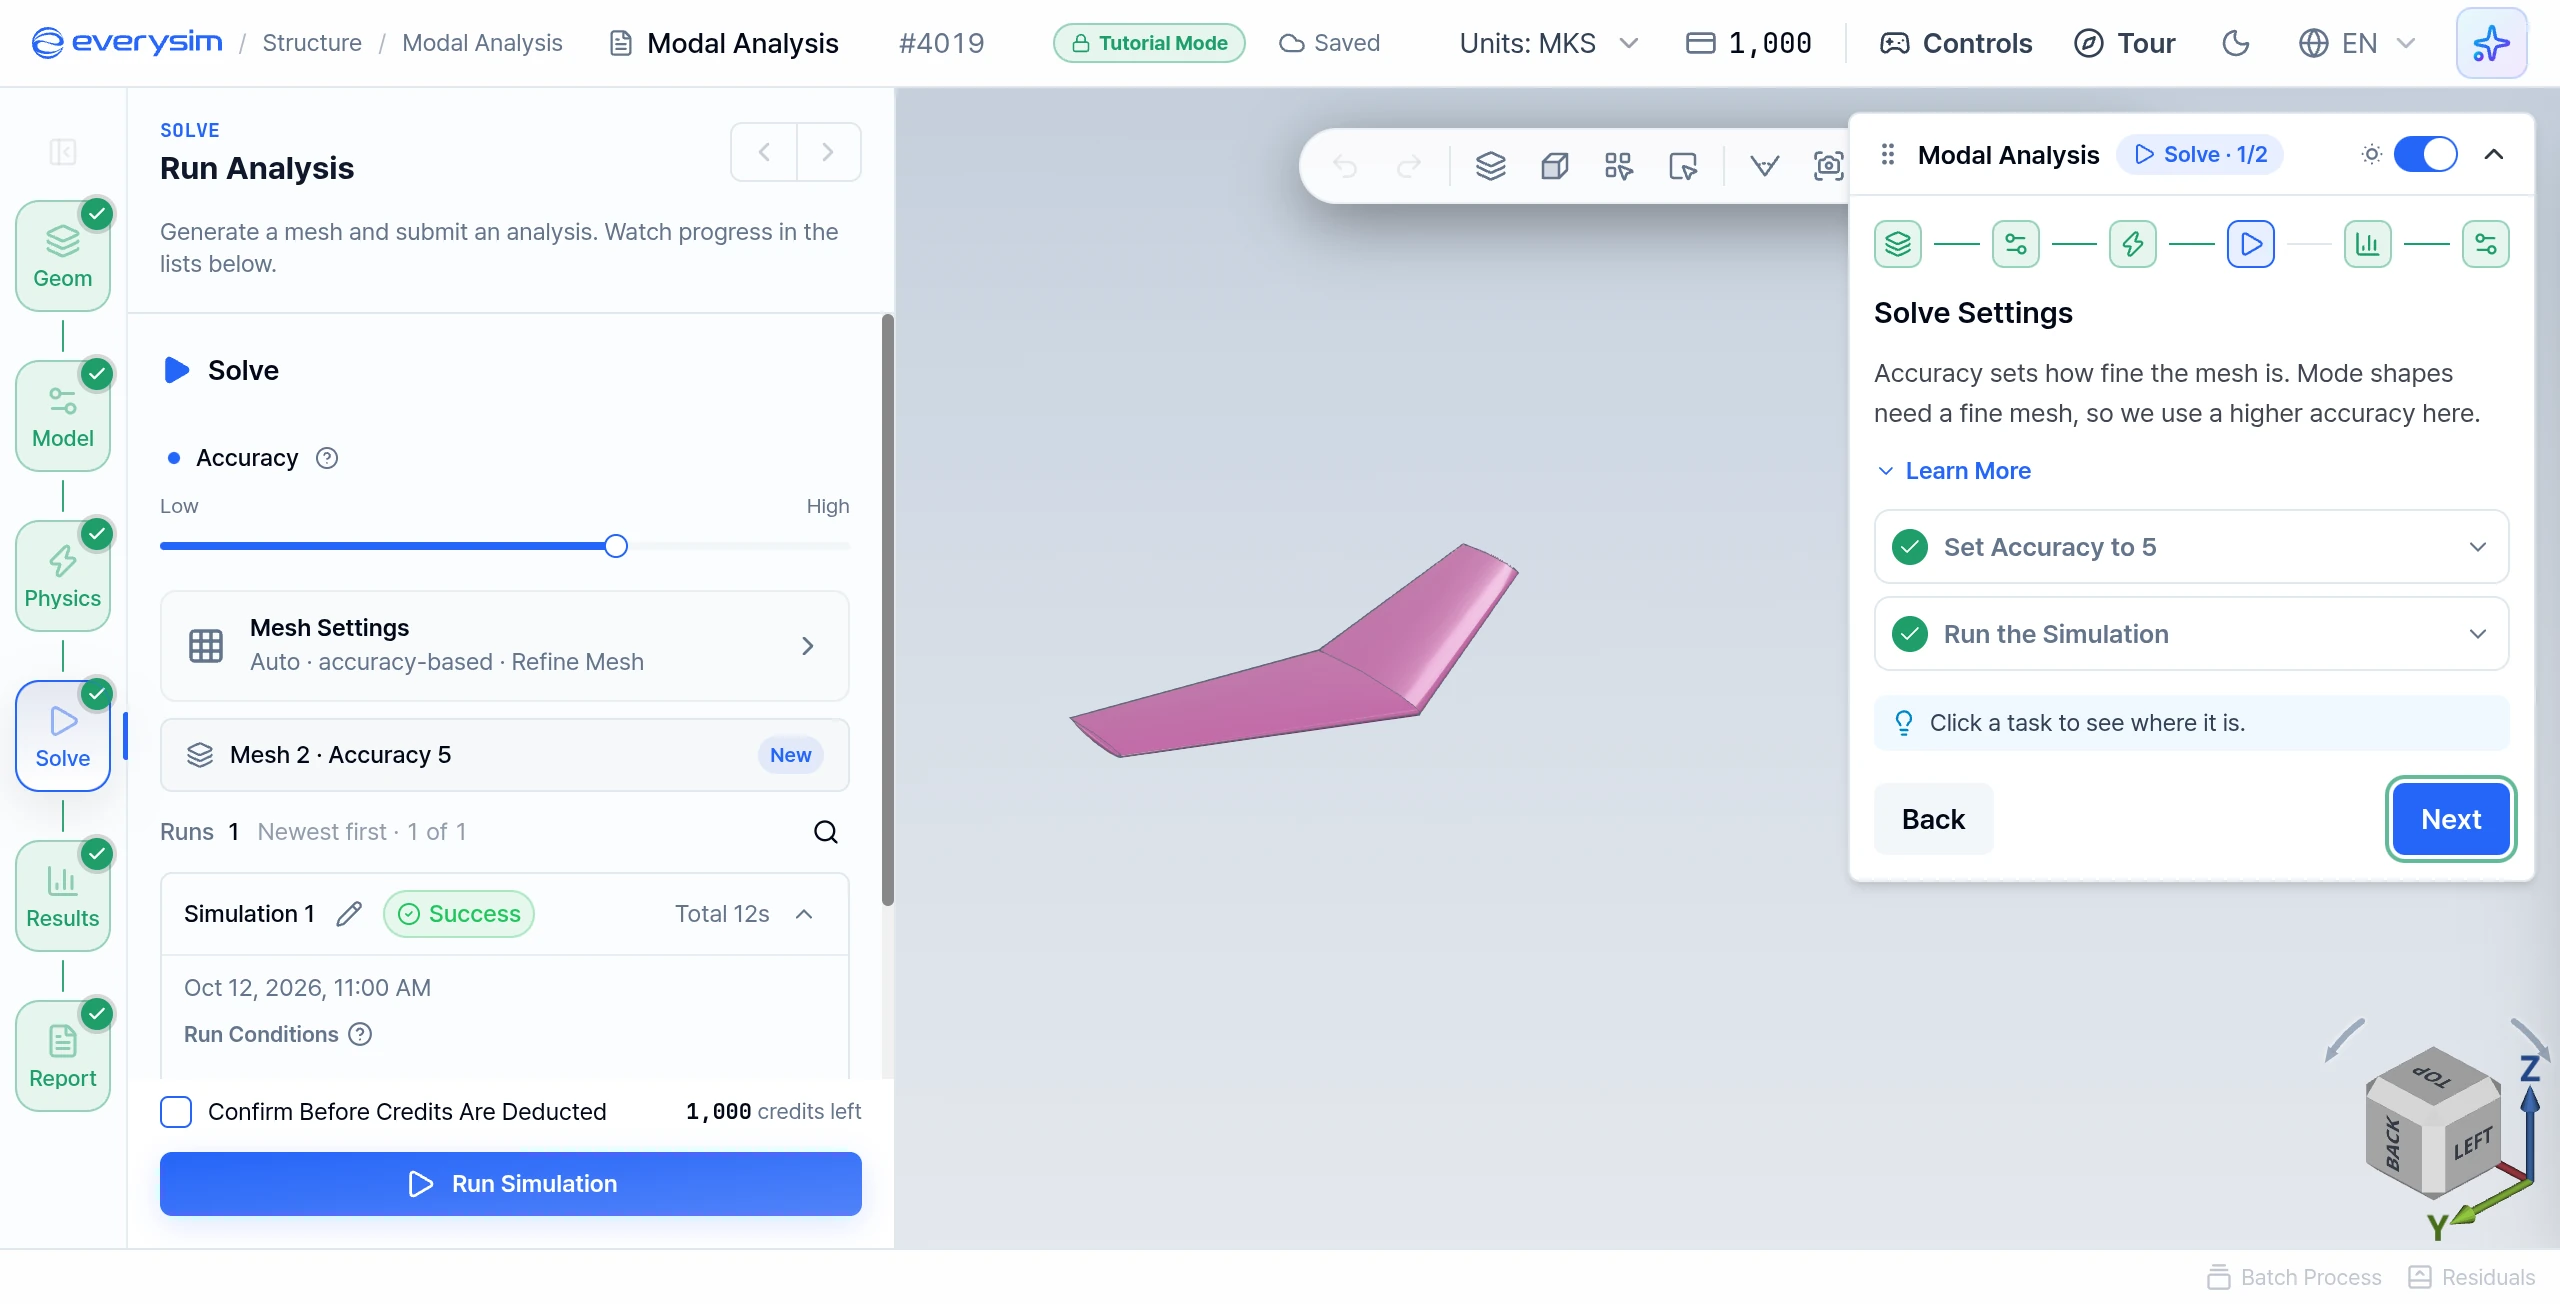
Accuracy sets how fine the mesh is. Mode shapes need a fine mesh, so this tutorial uses a higher accuracy.
- Set Accuracy to 5: move the slider to
5. - Run the Simulation: click Run Simulation at the bottom of the Solve panel.
A tutorial's Run does not submit a job and costs no credits. After about 3 seconds it opens a result computed in advance for this setup. The simulation card can still show an amount such as −1 credits, but tutorial runs are not charged.
6. Simulation Progress
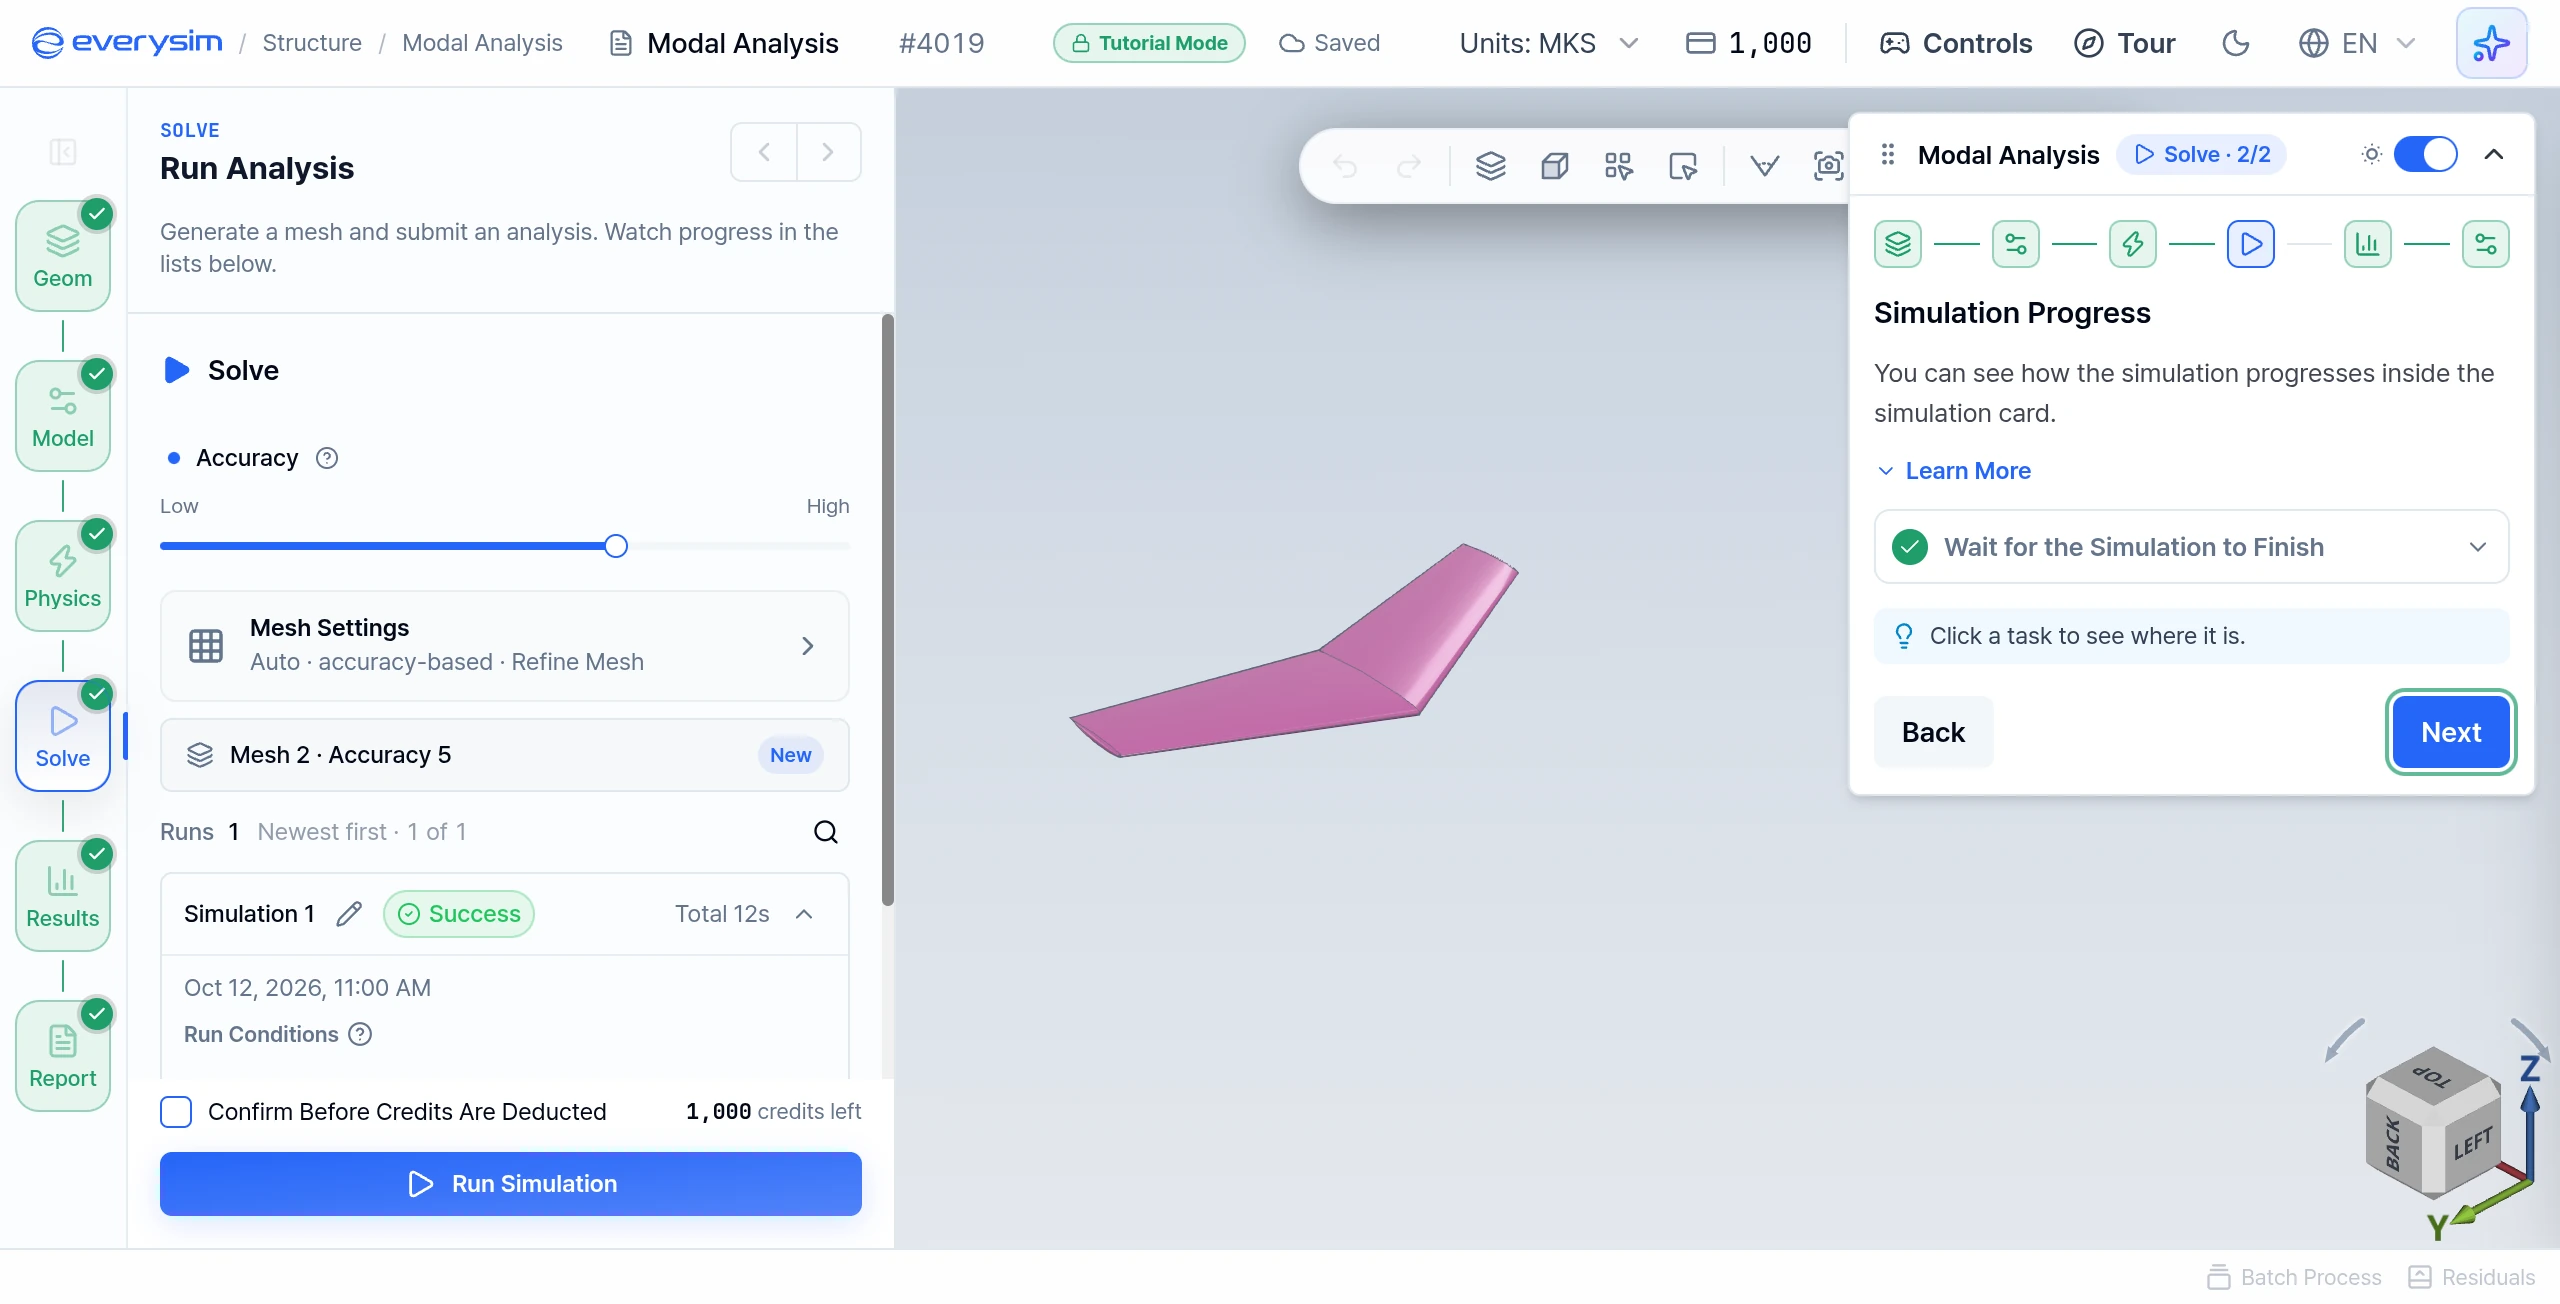
Wait for the Simulation to Finish: the simulation card shows the mesh step and then the analysis steps, each ticked as it completes. When the run is marked Success, the guide moves on and the results open.
7. Your Results
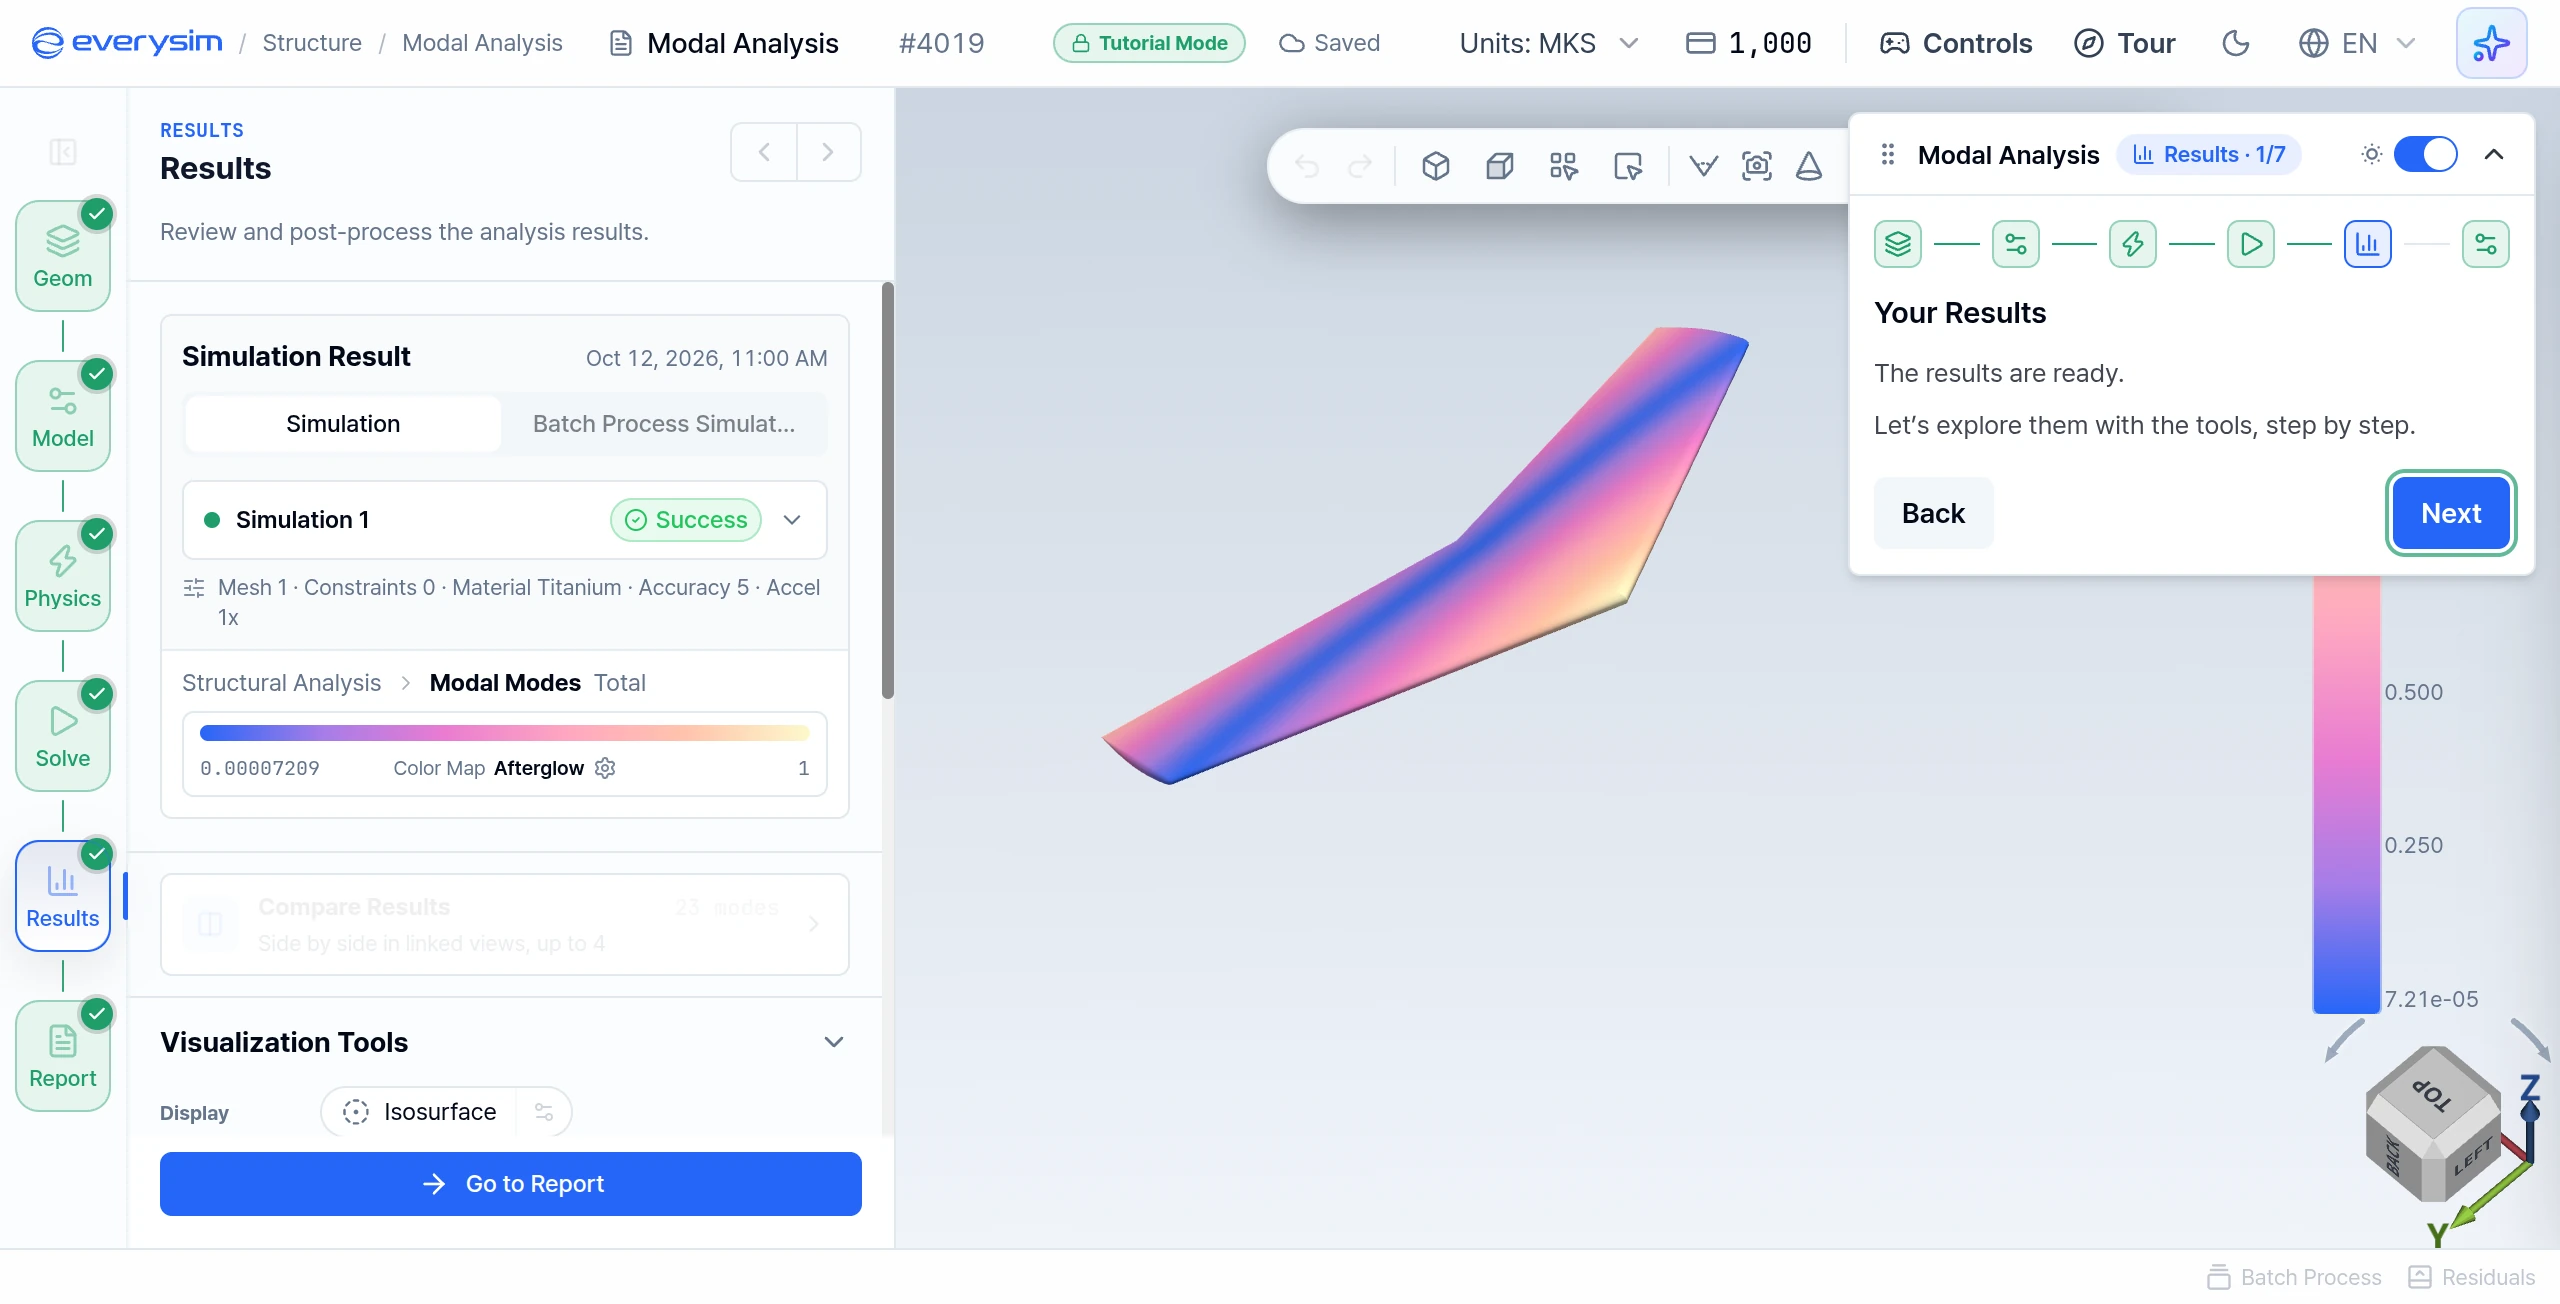
This page only announces the results. Press Next to explore them.
8. Vibration Modes
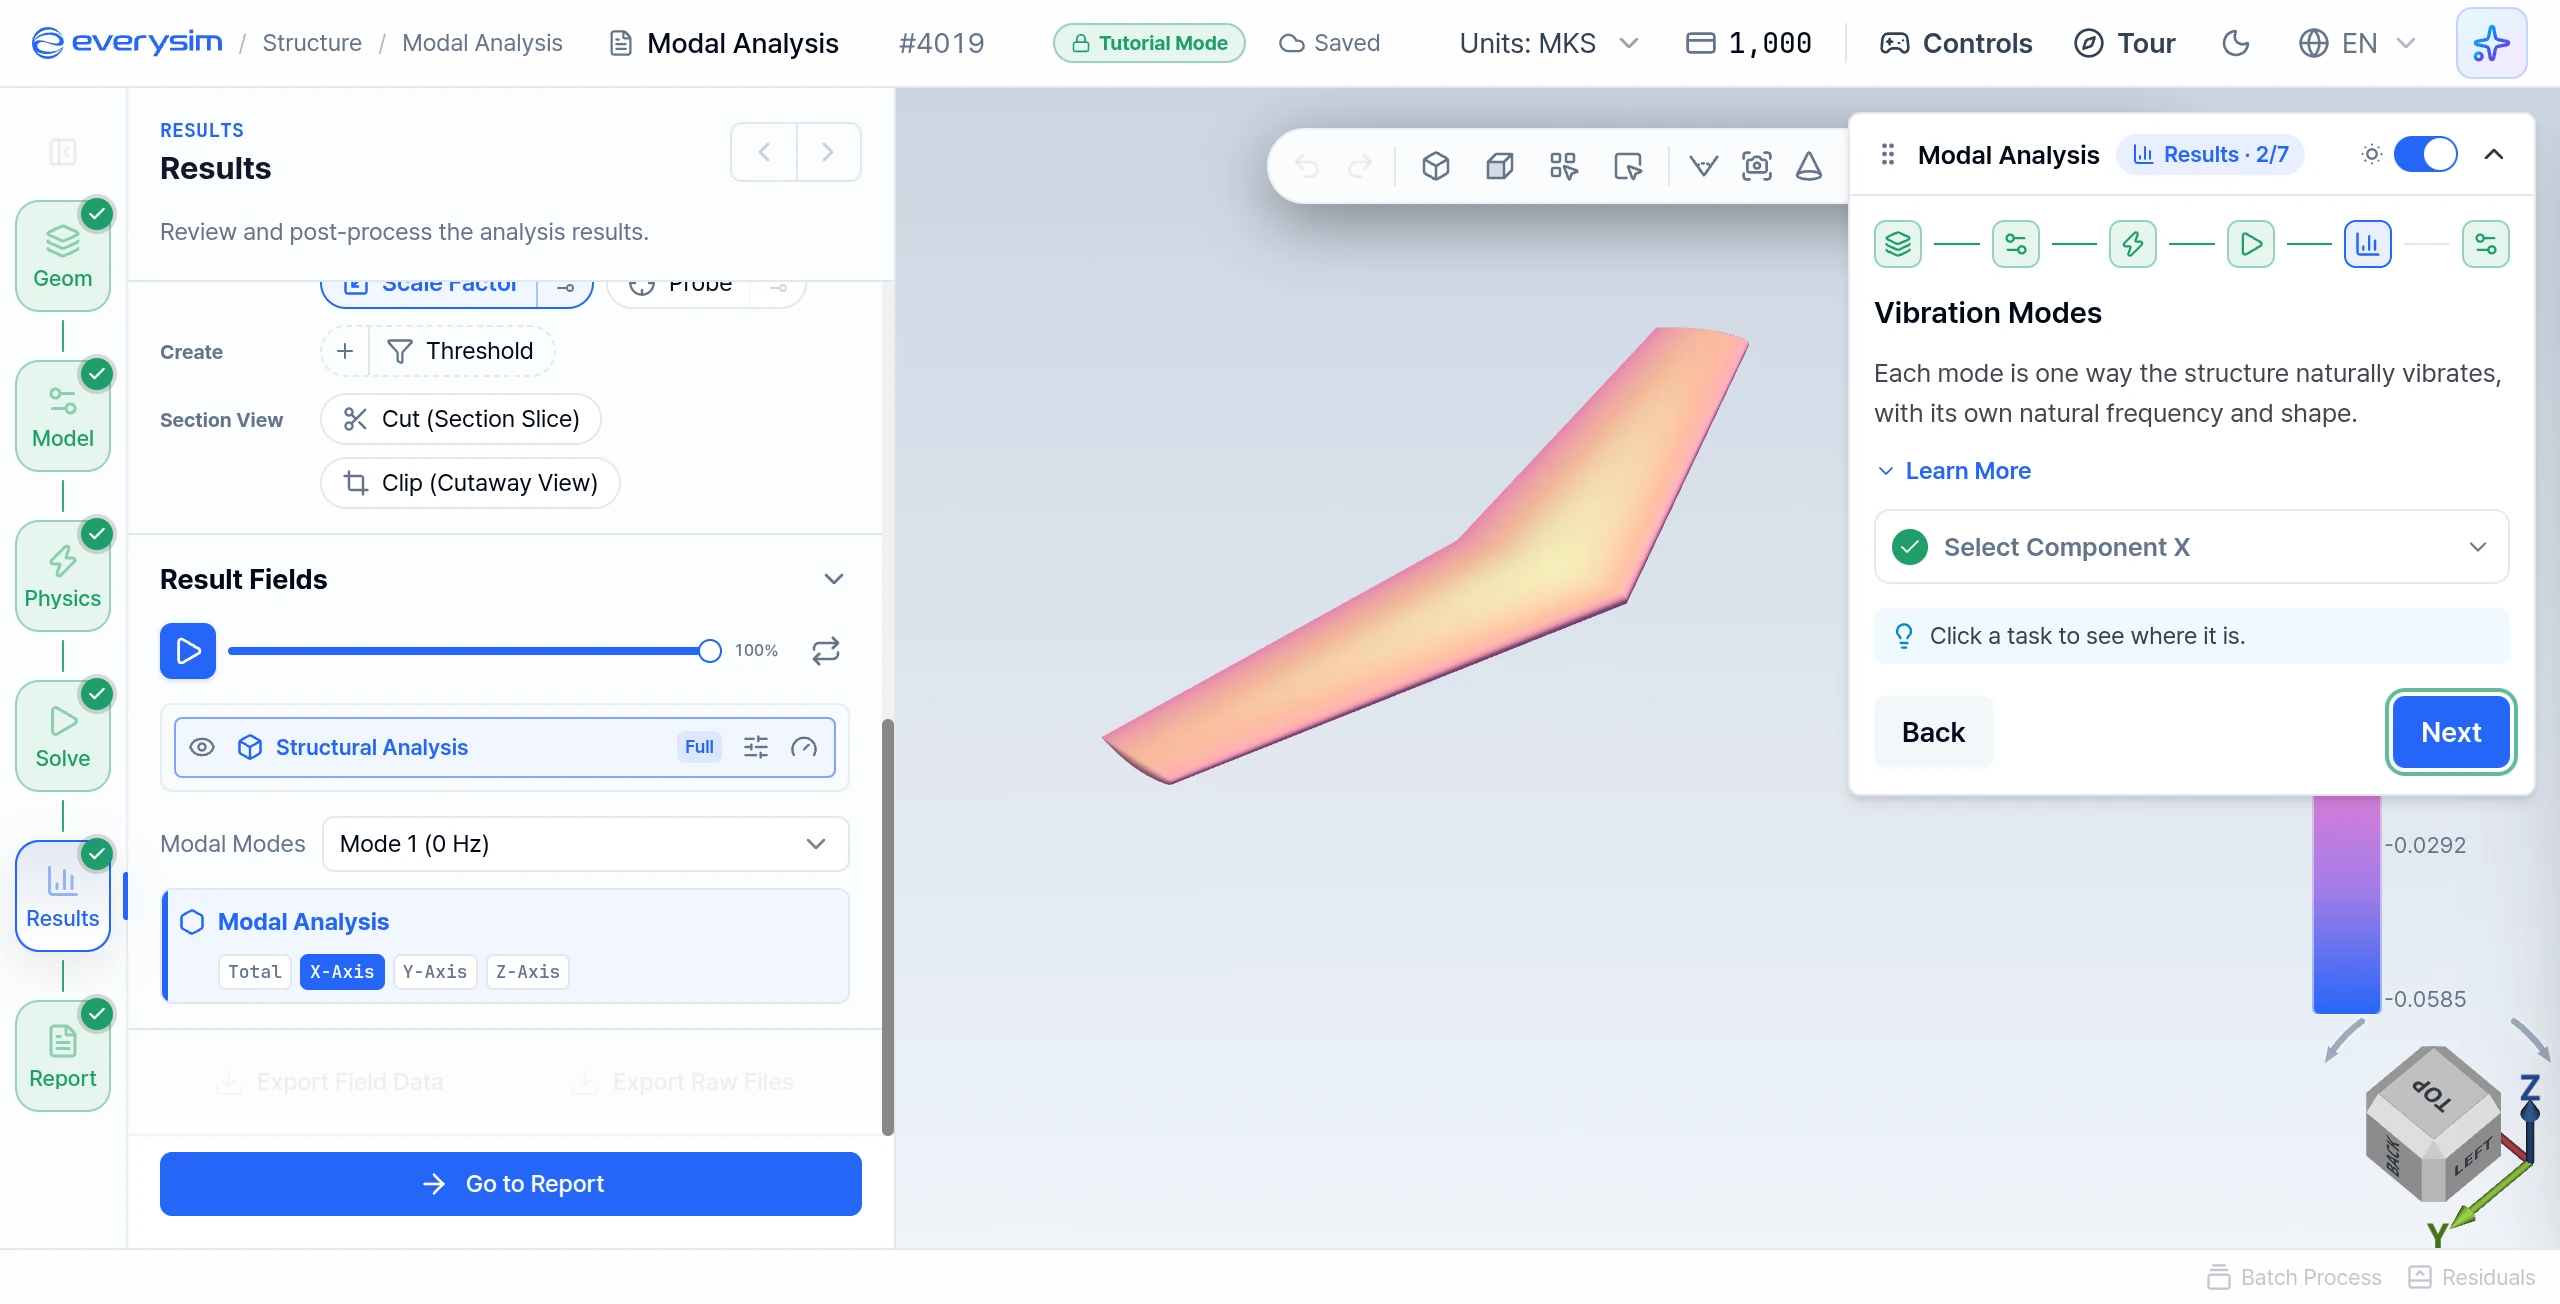
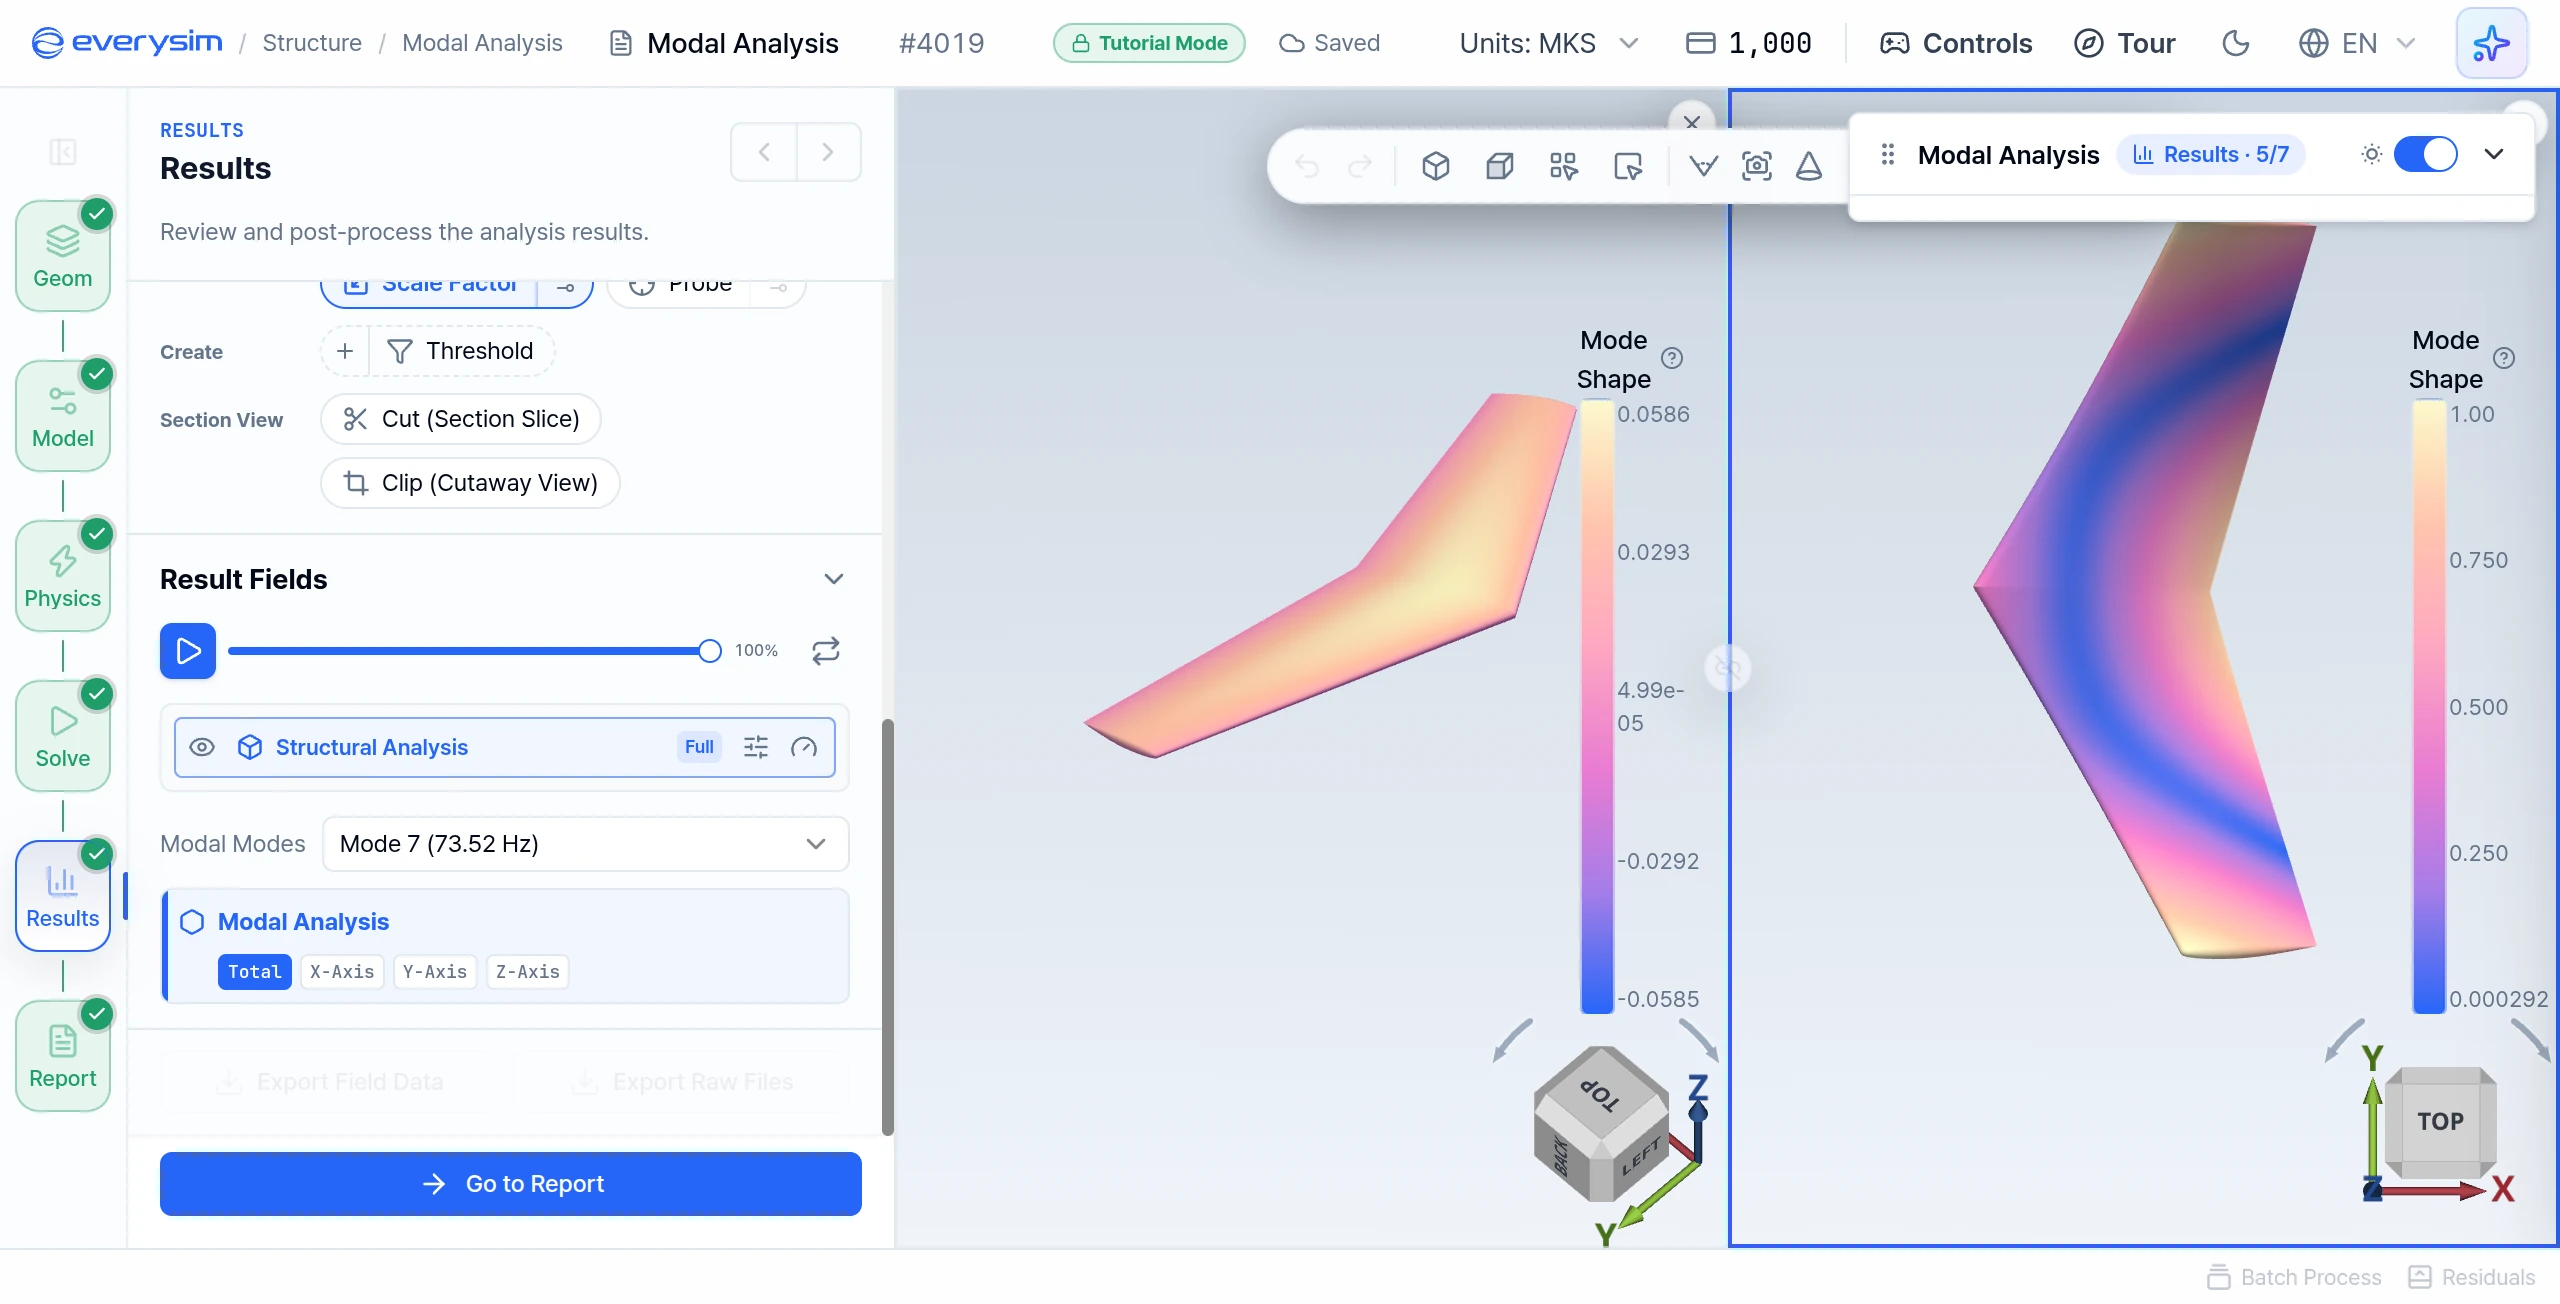
Each mode is one way the structure naturally vibrates, with its own natural frequency and shape. The colours show how much each part moves in that mode. The Mode Shape legend shows relative values without units, not real distances.
- Select Component X: Mode 1 is already selected. Click X-Axis in the result fields to see the X-direction distribution for that mode.
9. Mode Shape Animation
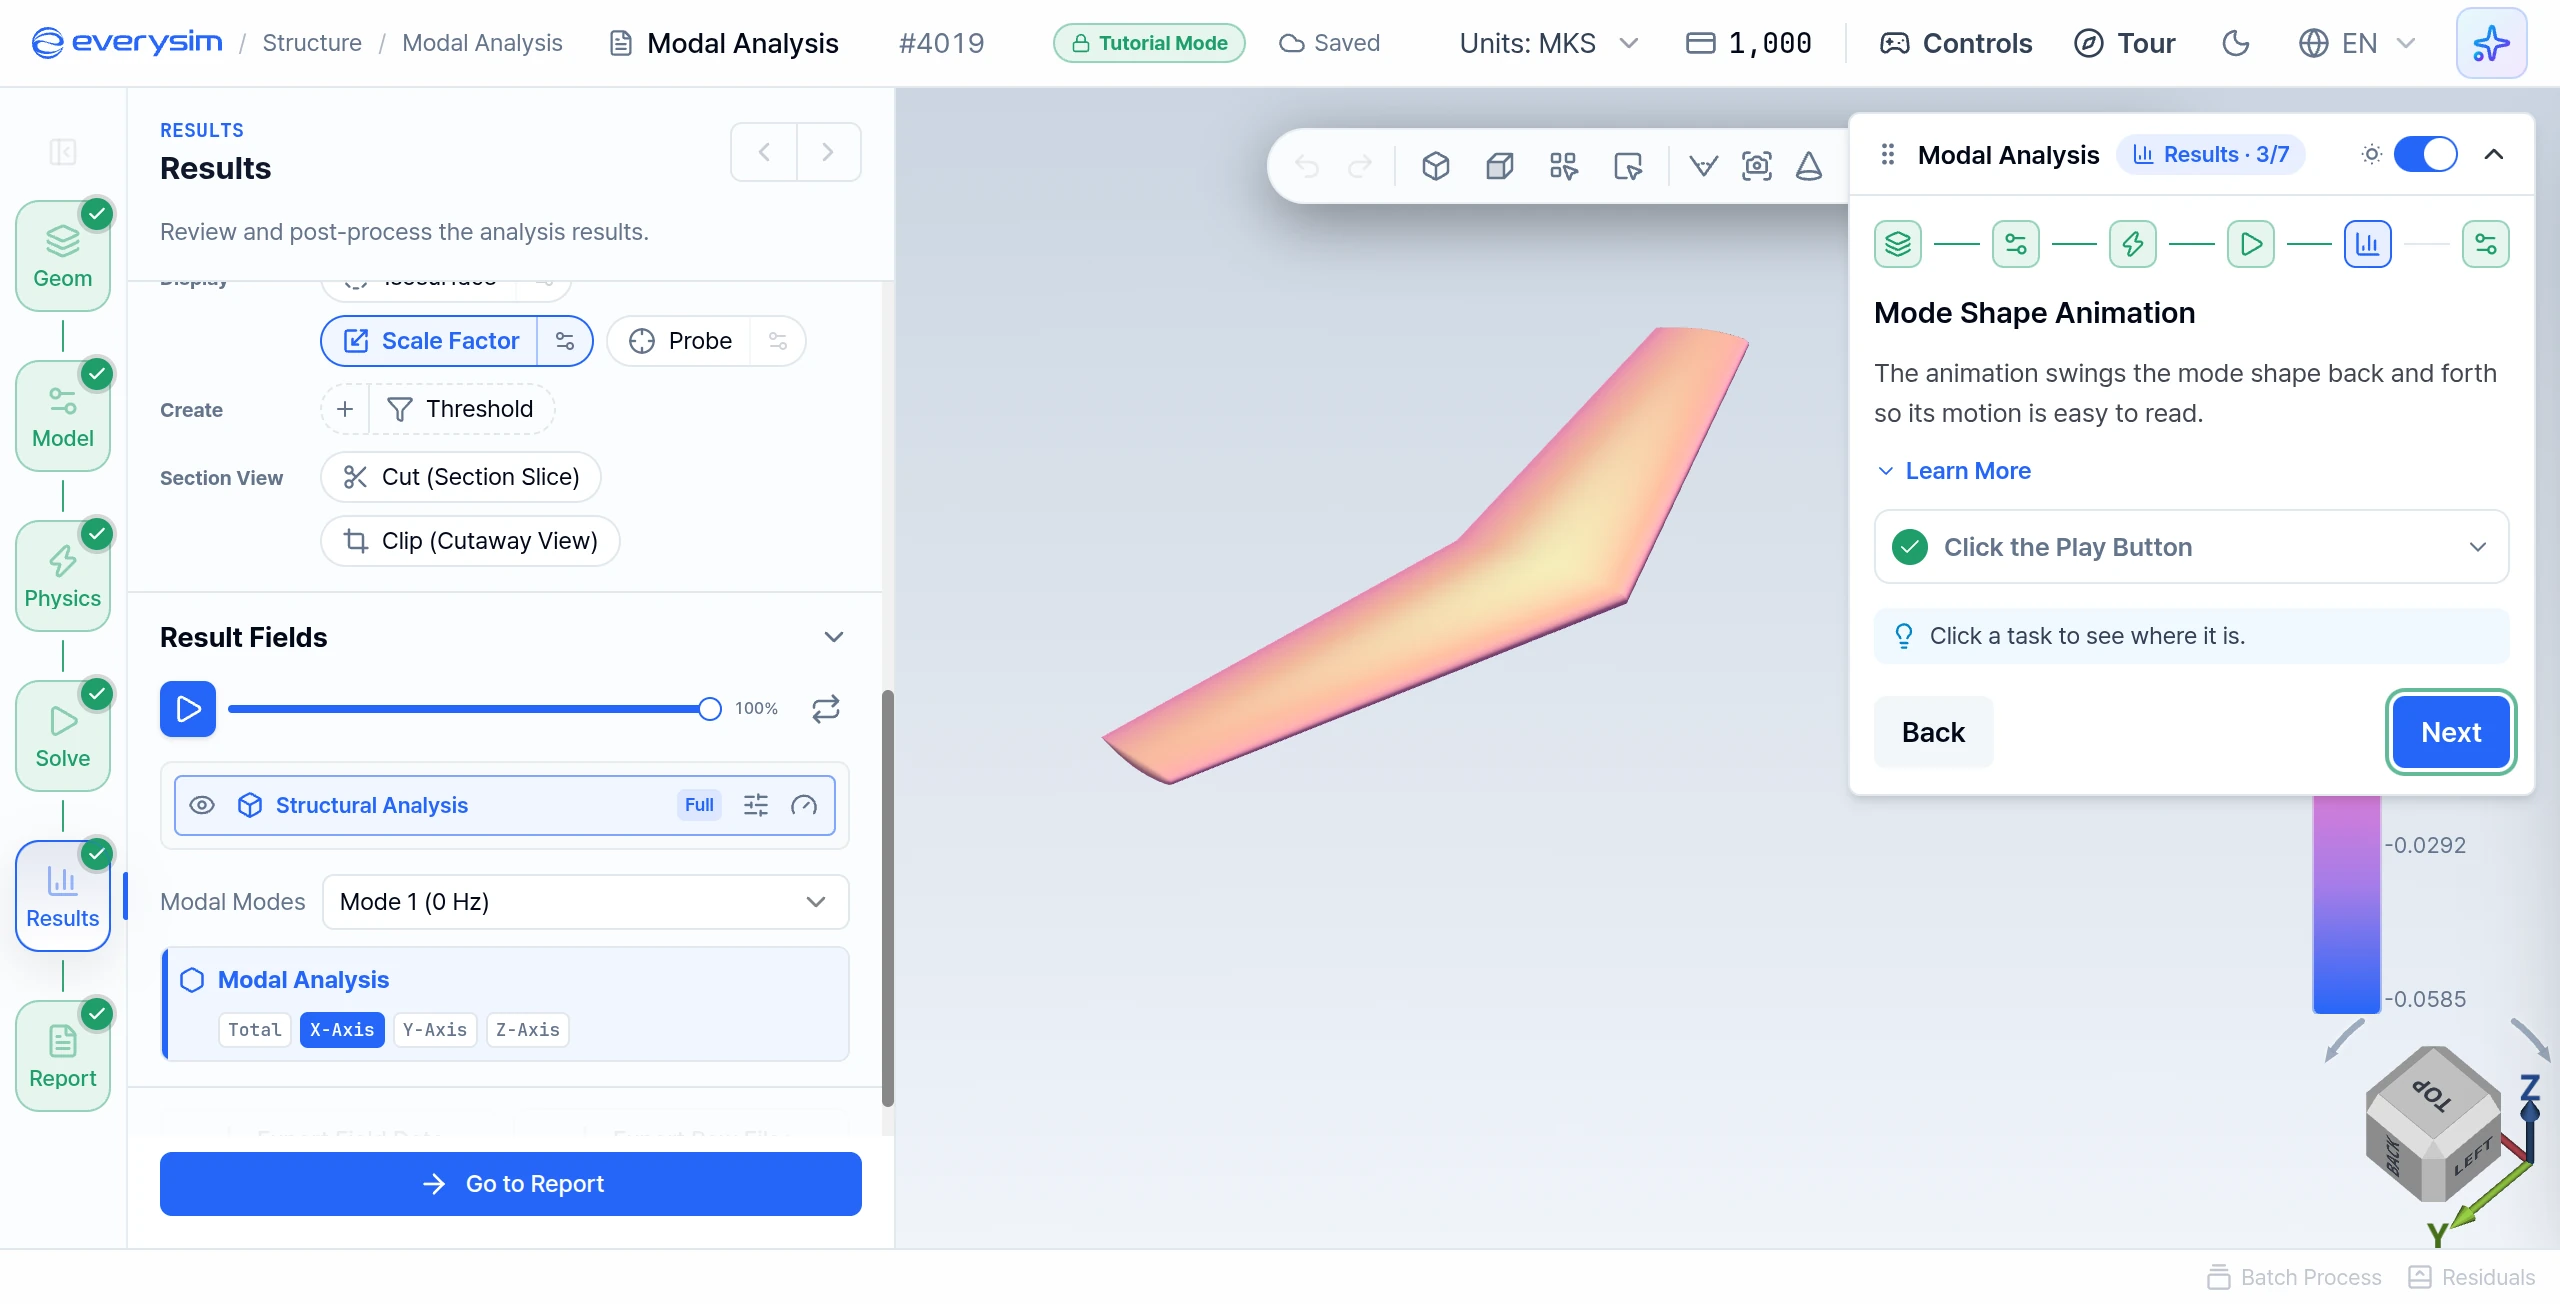
The animation swings the mode shape back and forth so its motion is easy to read. It is scaled so the displacement is easier to see. Scale Factor controls that scale.
- Click the Play Button: press play above the result fields and watch to the end.
10. Split the View
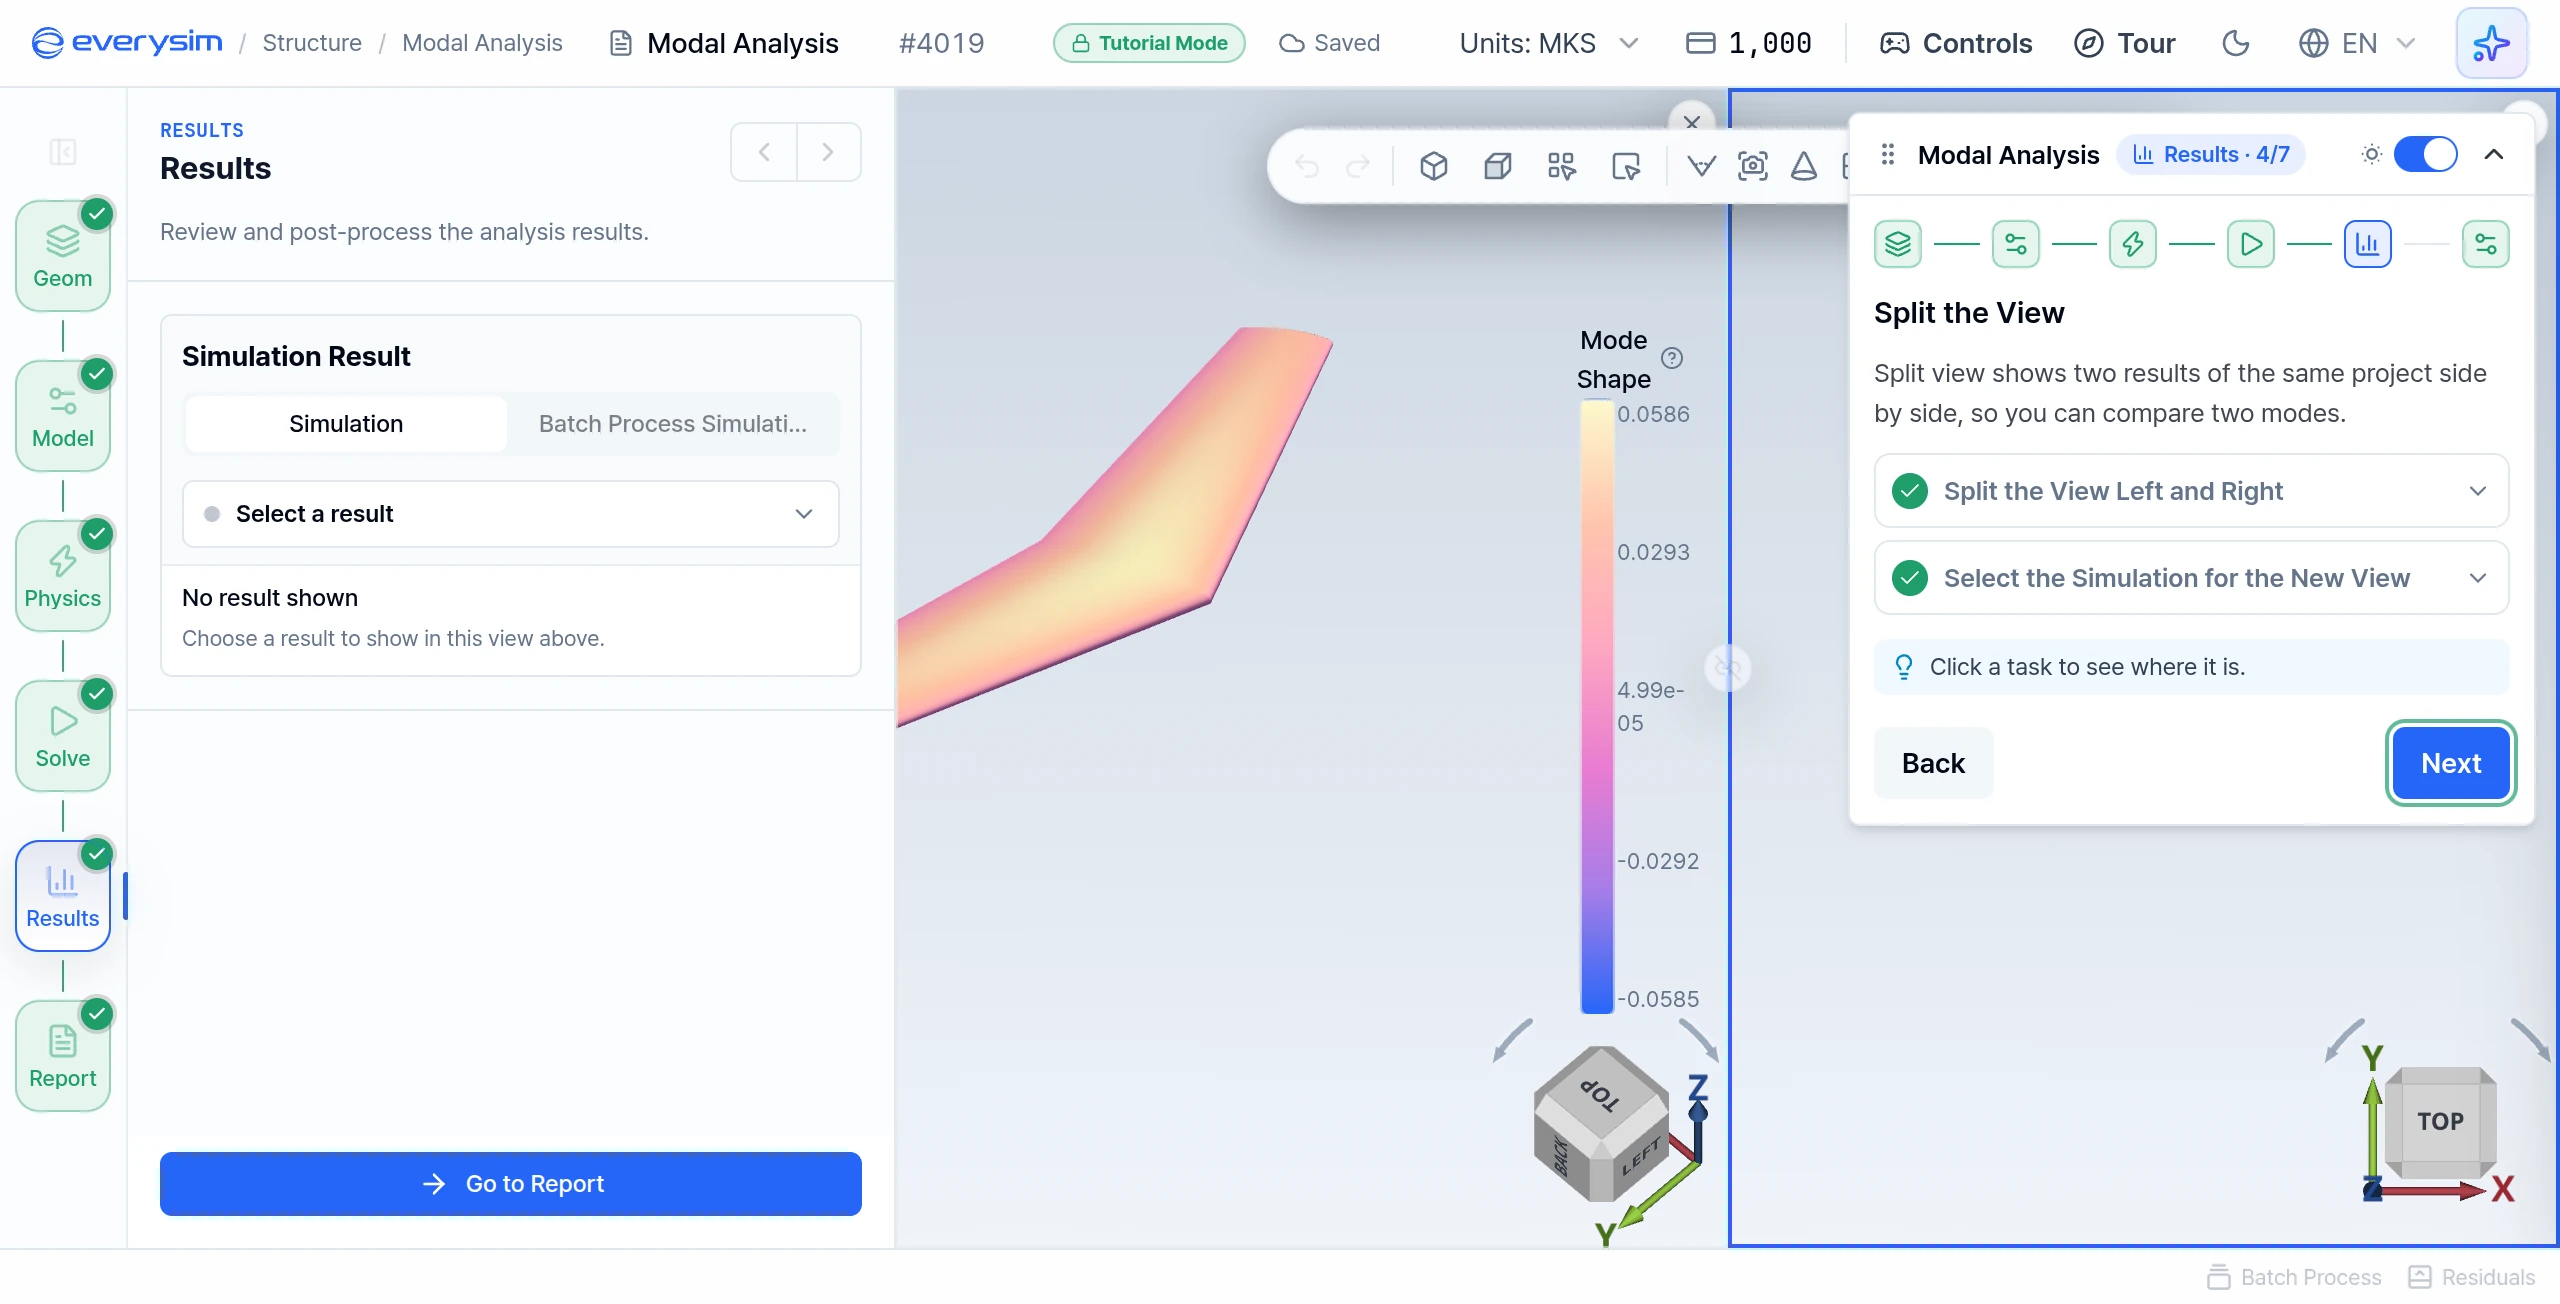
Split view shows two results of the same project side by side.
- Split the View Left and Right: click Split Left/Right in the toolbar.
- Select the Simulation for the New View: the new view is selected and still empty. In the Simulation Result dropdown, select Simulation 1.
11. Compare Modes
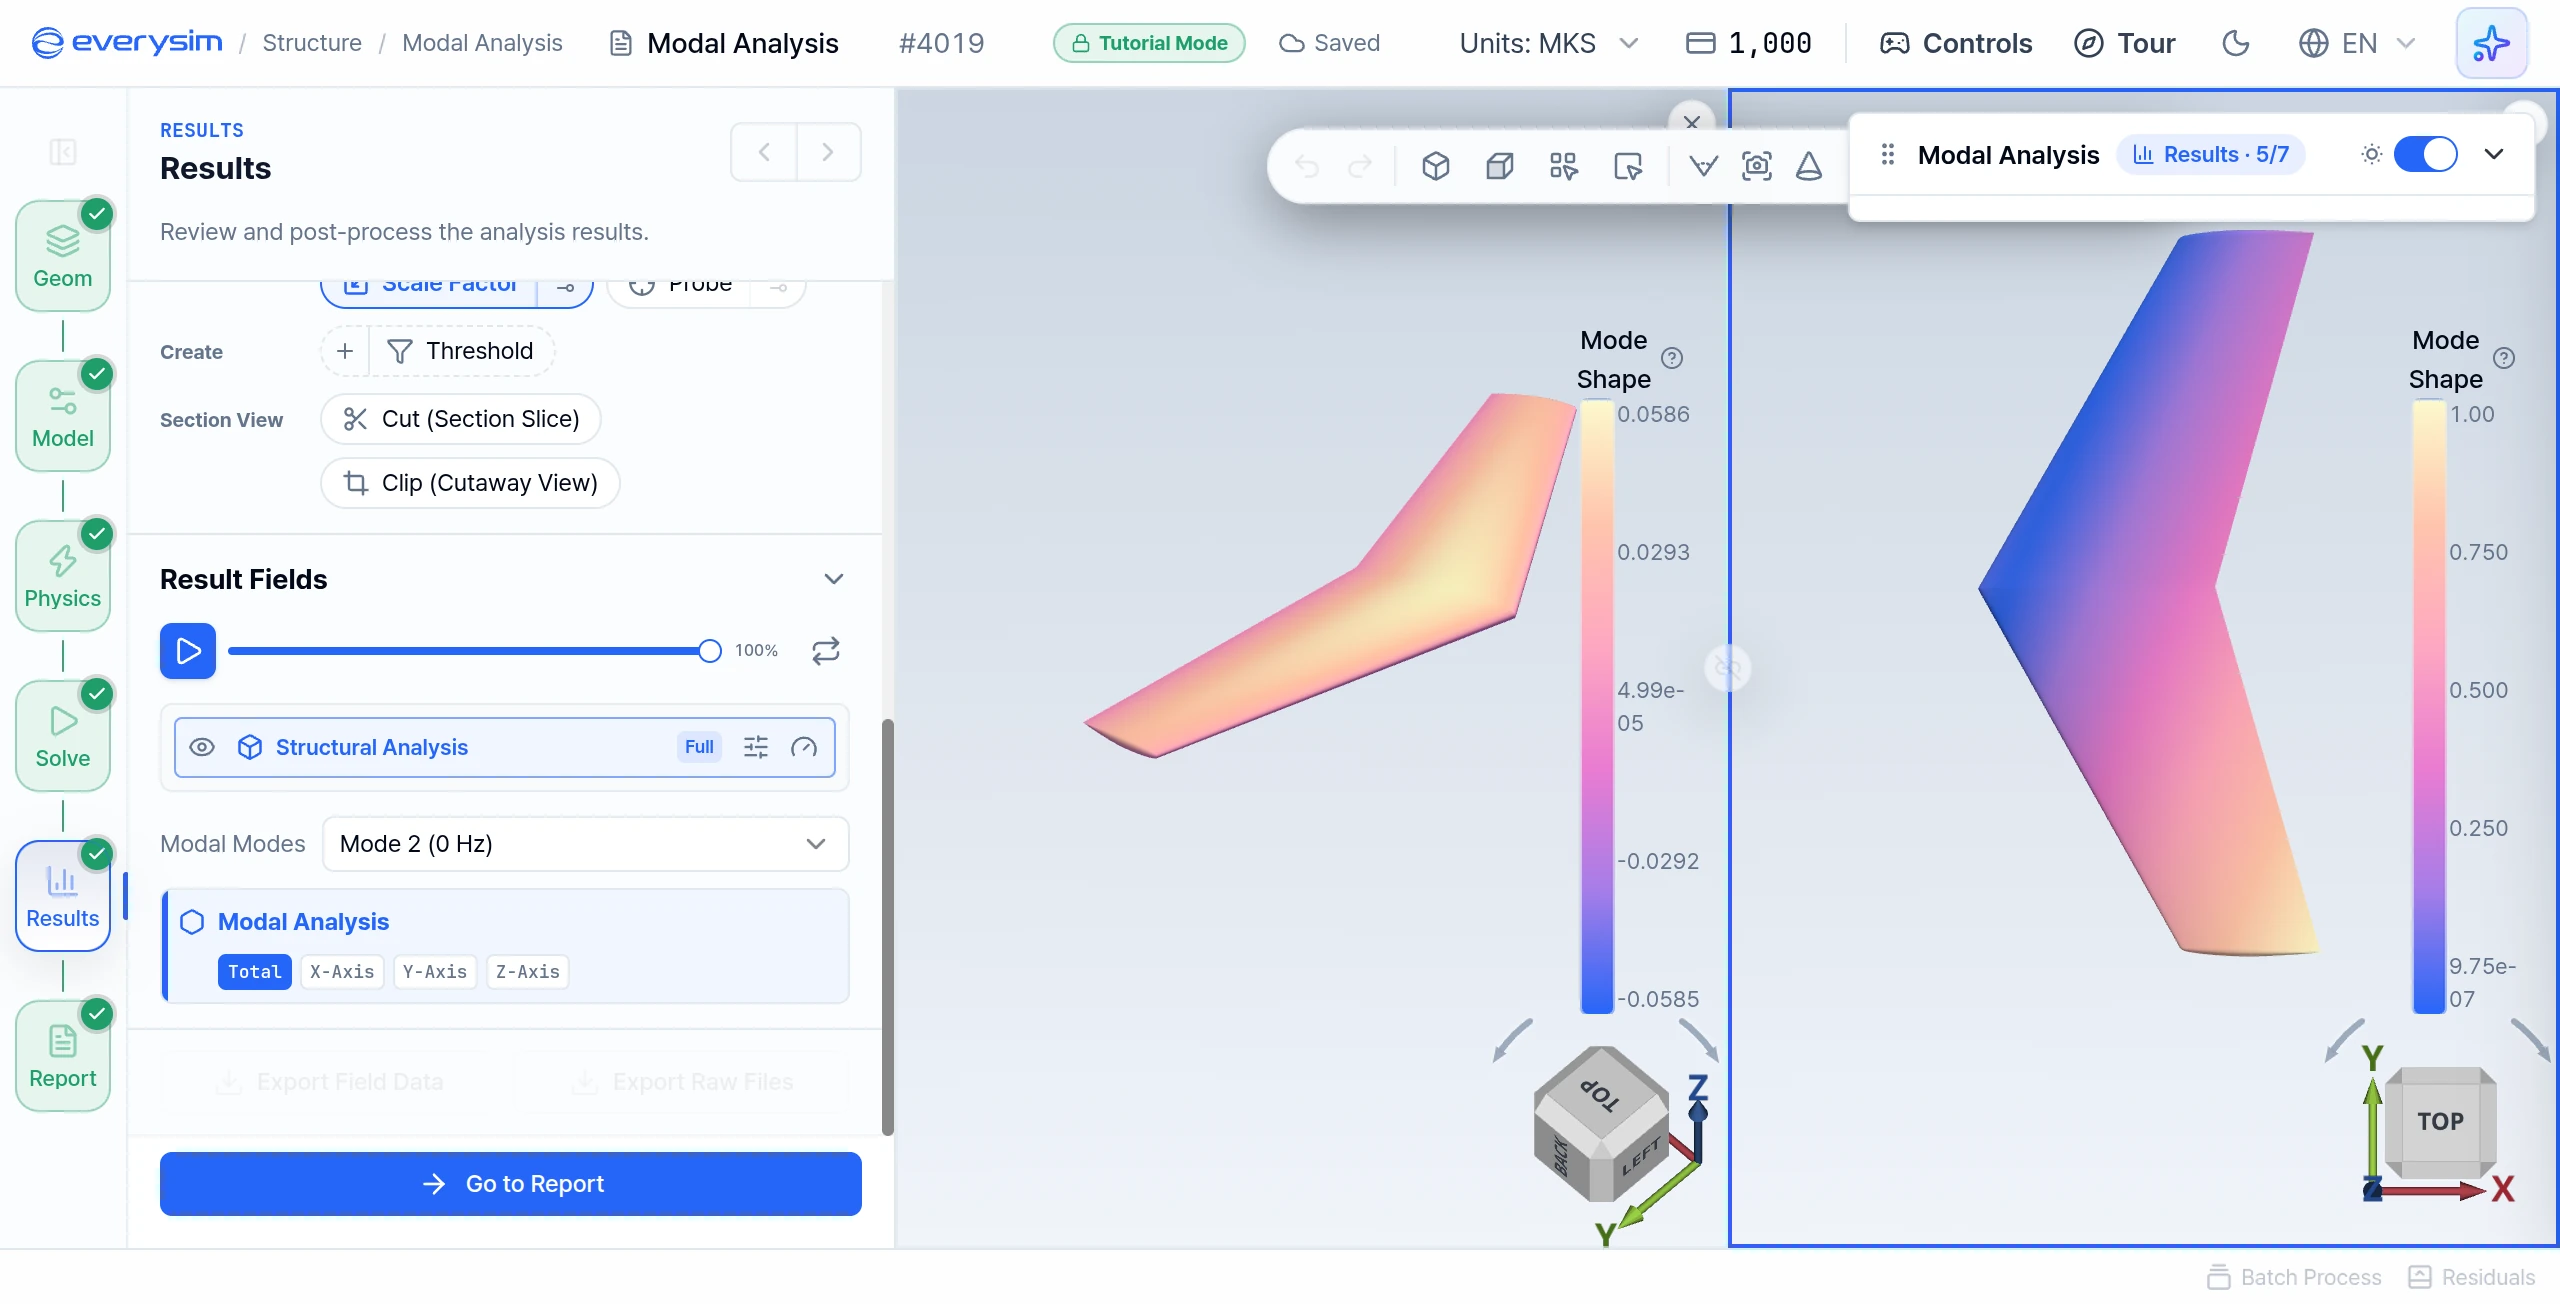
Selections in the sidebar apply to the view that is currently selected. If a vibration source such as a motor runs close to a natural frequency, the structure resonates and the vibration grows, so knowing the modes lets you design away from them.
- Select Mode 2: it appears in the right view.
- Play the Animation for Mode 2: press play.
- Click the Left View: click anywhere in the left view to select it.
- Play the Animation for Mode 1: press play.
Rigid-body and elastic modes
A free body can move as a whole without deforming, so a Free-Free run finds six rigid-body modes near 0 Hz before any elastic mode. In this result Modes 1 to 6 are listed at 0 Hz, including the Modes 1 and 2 the tasks use. Wing bending begins at Mode 7, 73.52 Hz. Open it from the same Modal Modes dropdown to see it:
12. Change the Color Map
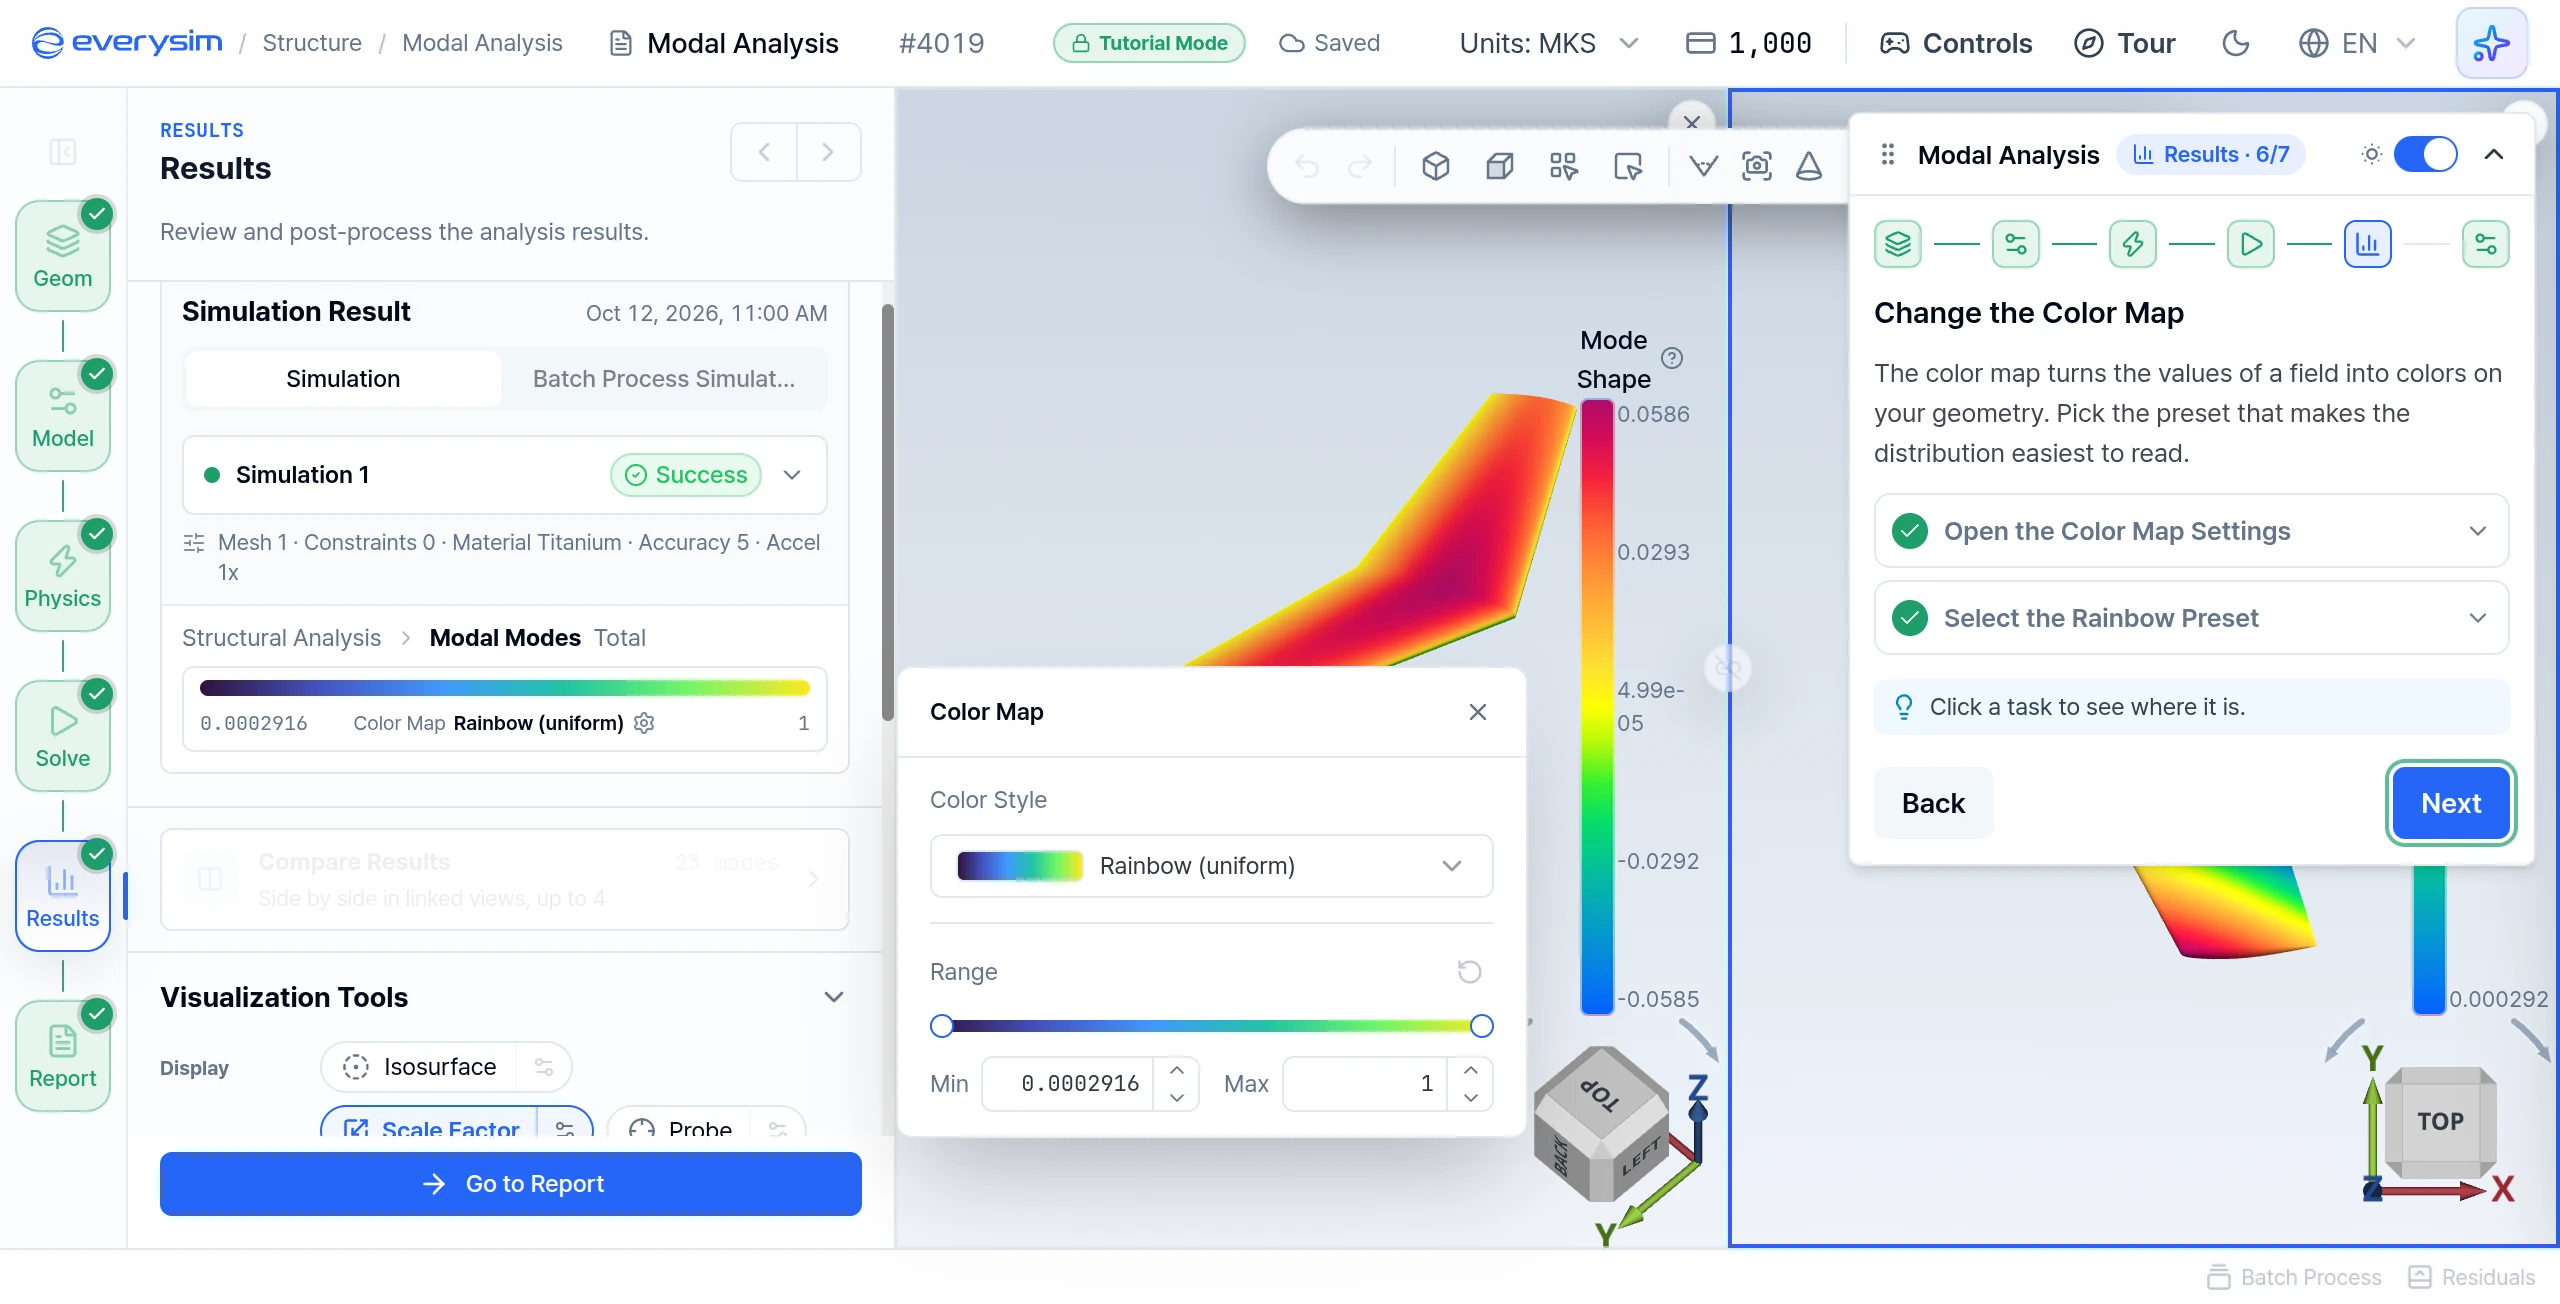
The color map turns the values of a field into colors on the geometry.
- Open the Color Map Settings: click the color map bar in the Simulation Result card.
- Select the Rainbow Preset: choose Rainbow (uniform) under Color Style.
13. Report
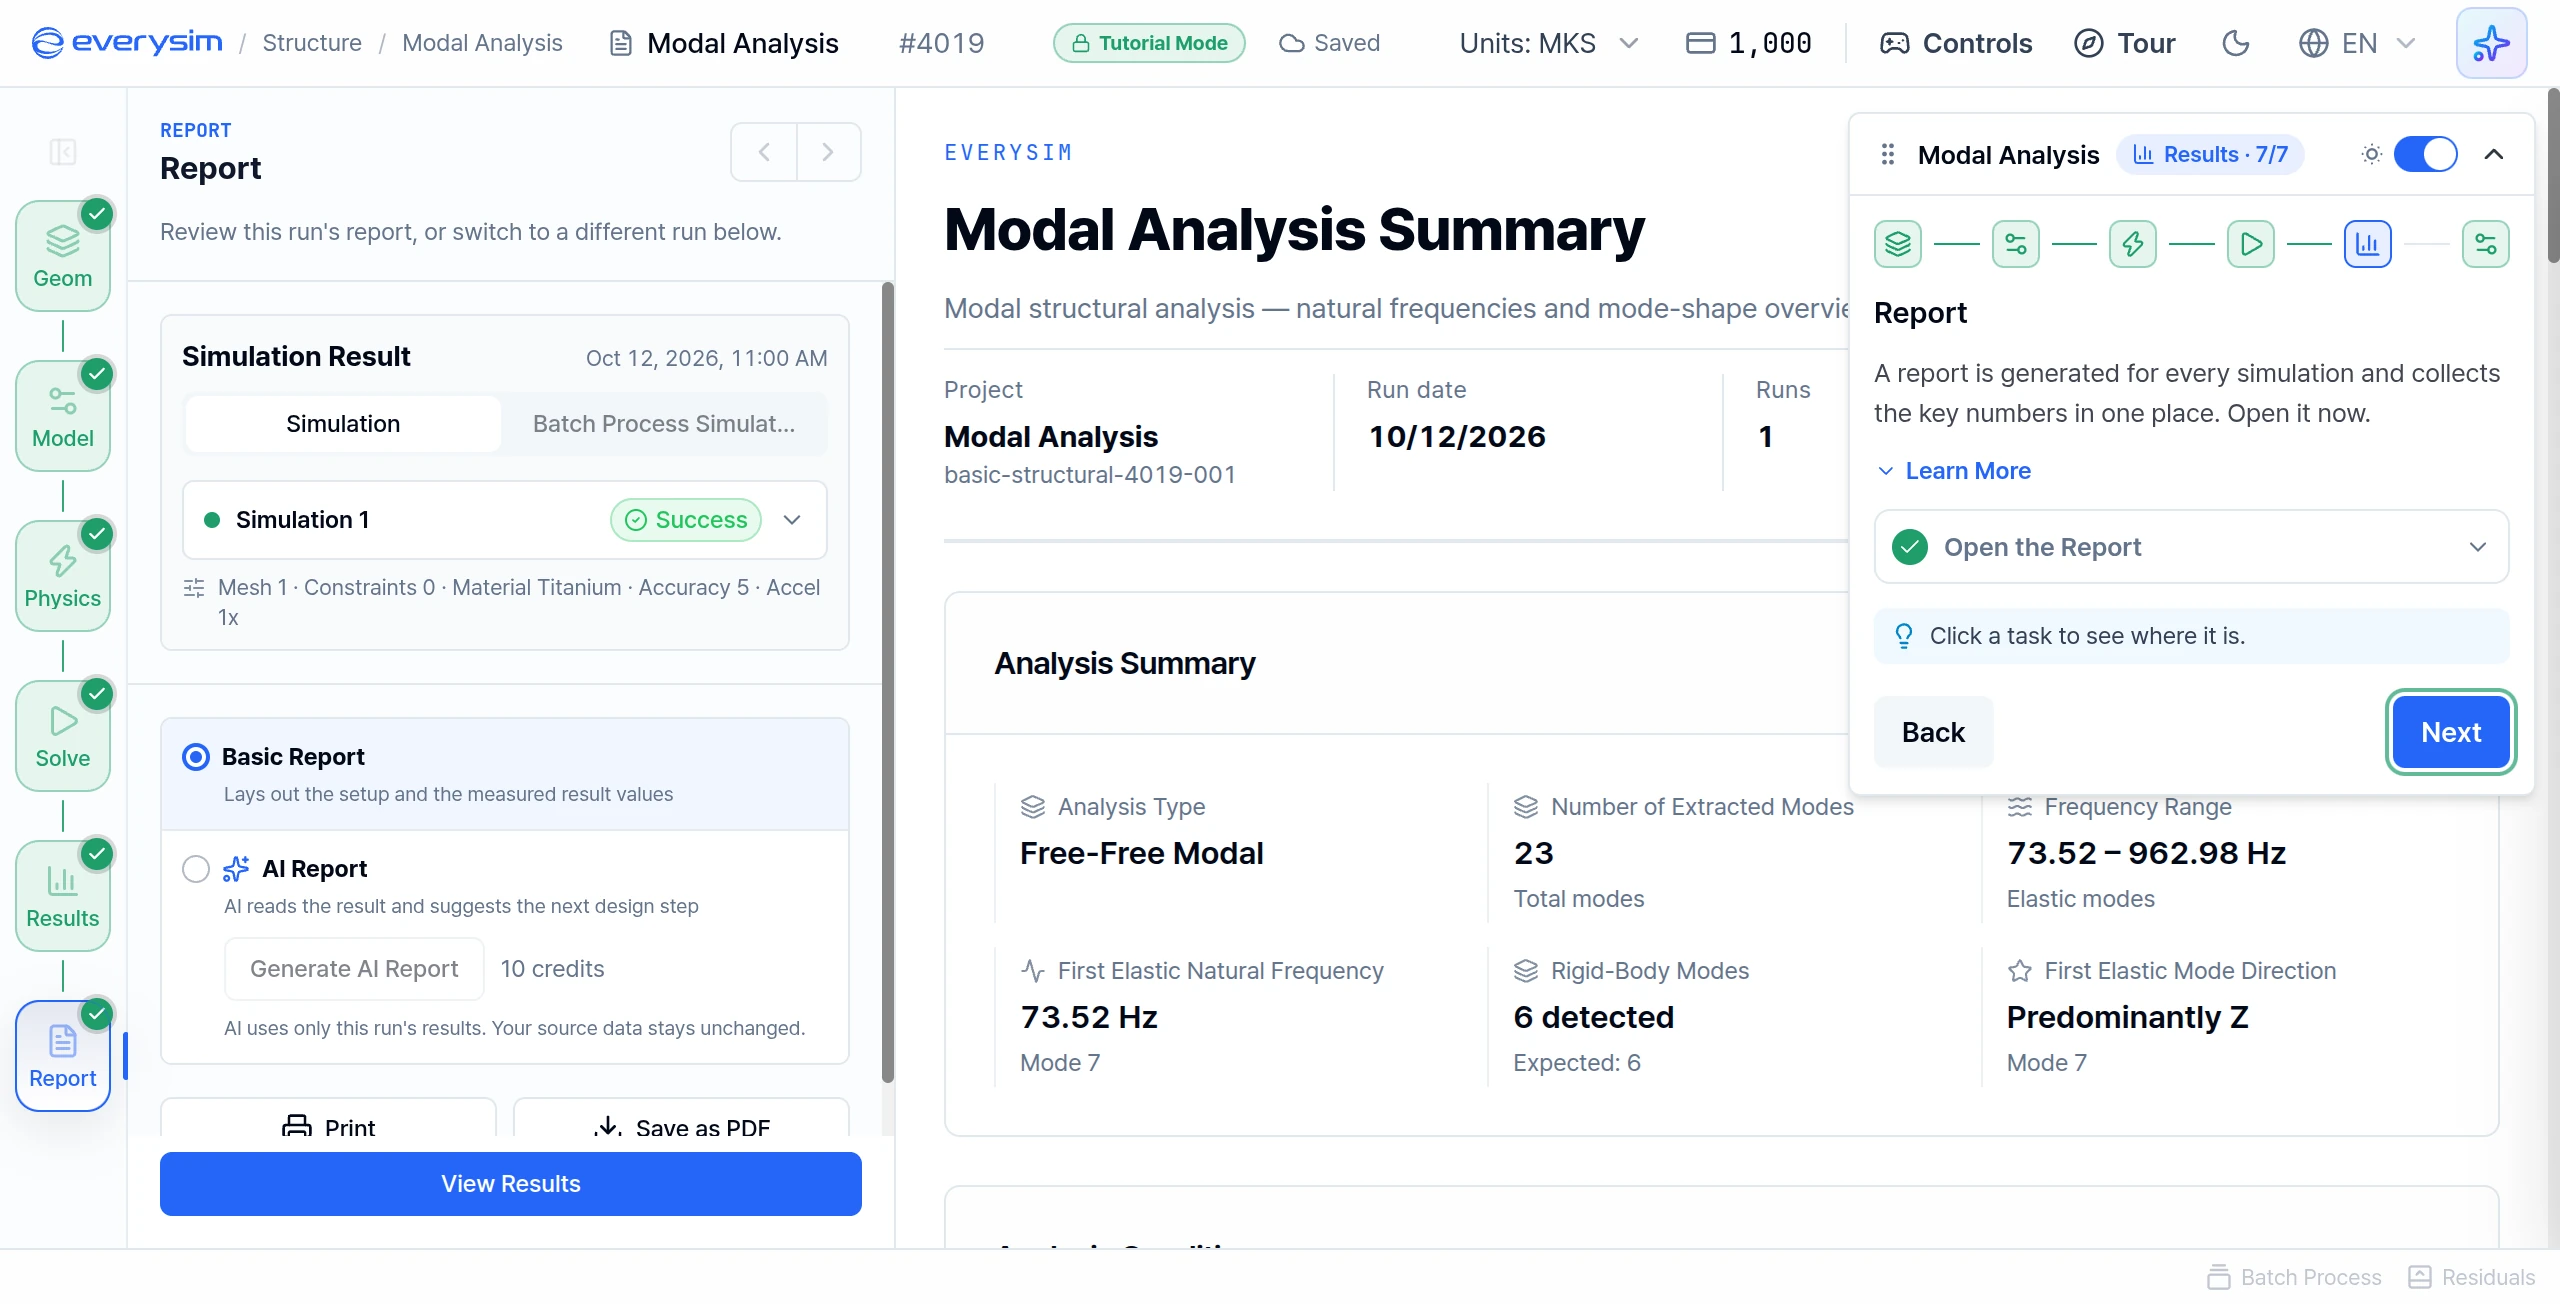
A report is generated for every simulation and collects the key numbers in one place.
- Open the Report: click Go to Report at the bottom of the panel. The guide moves on by itself.
14. Modal Results
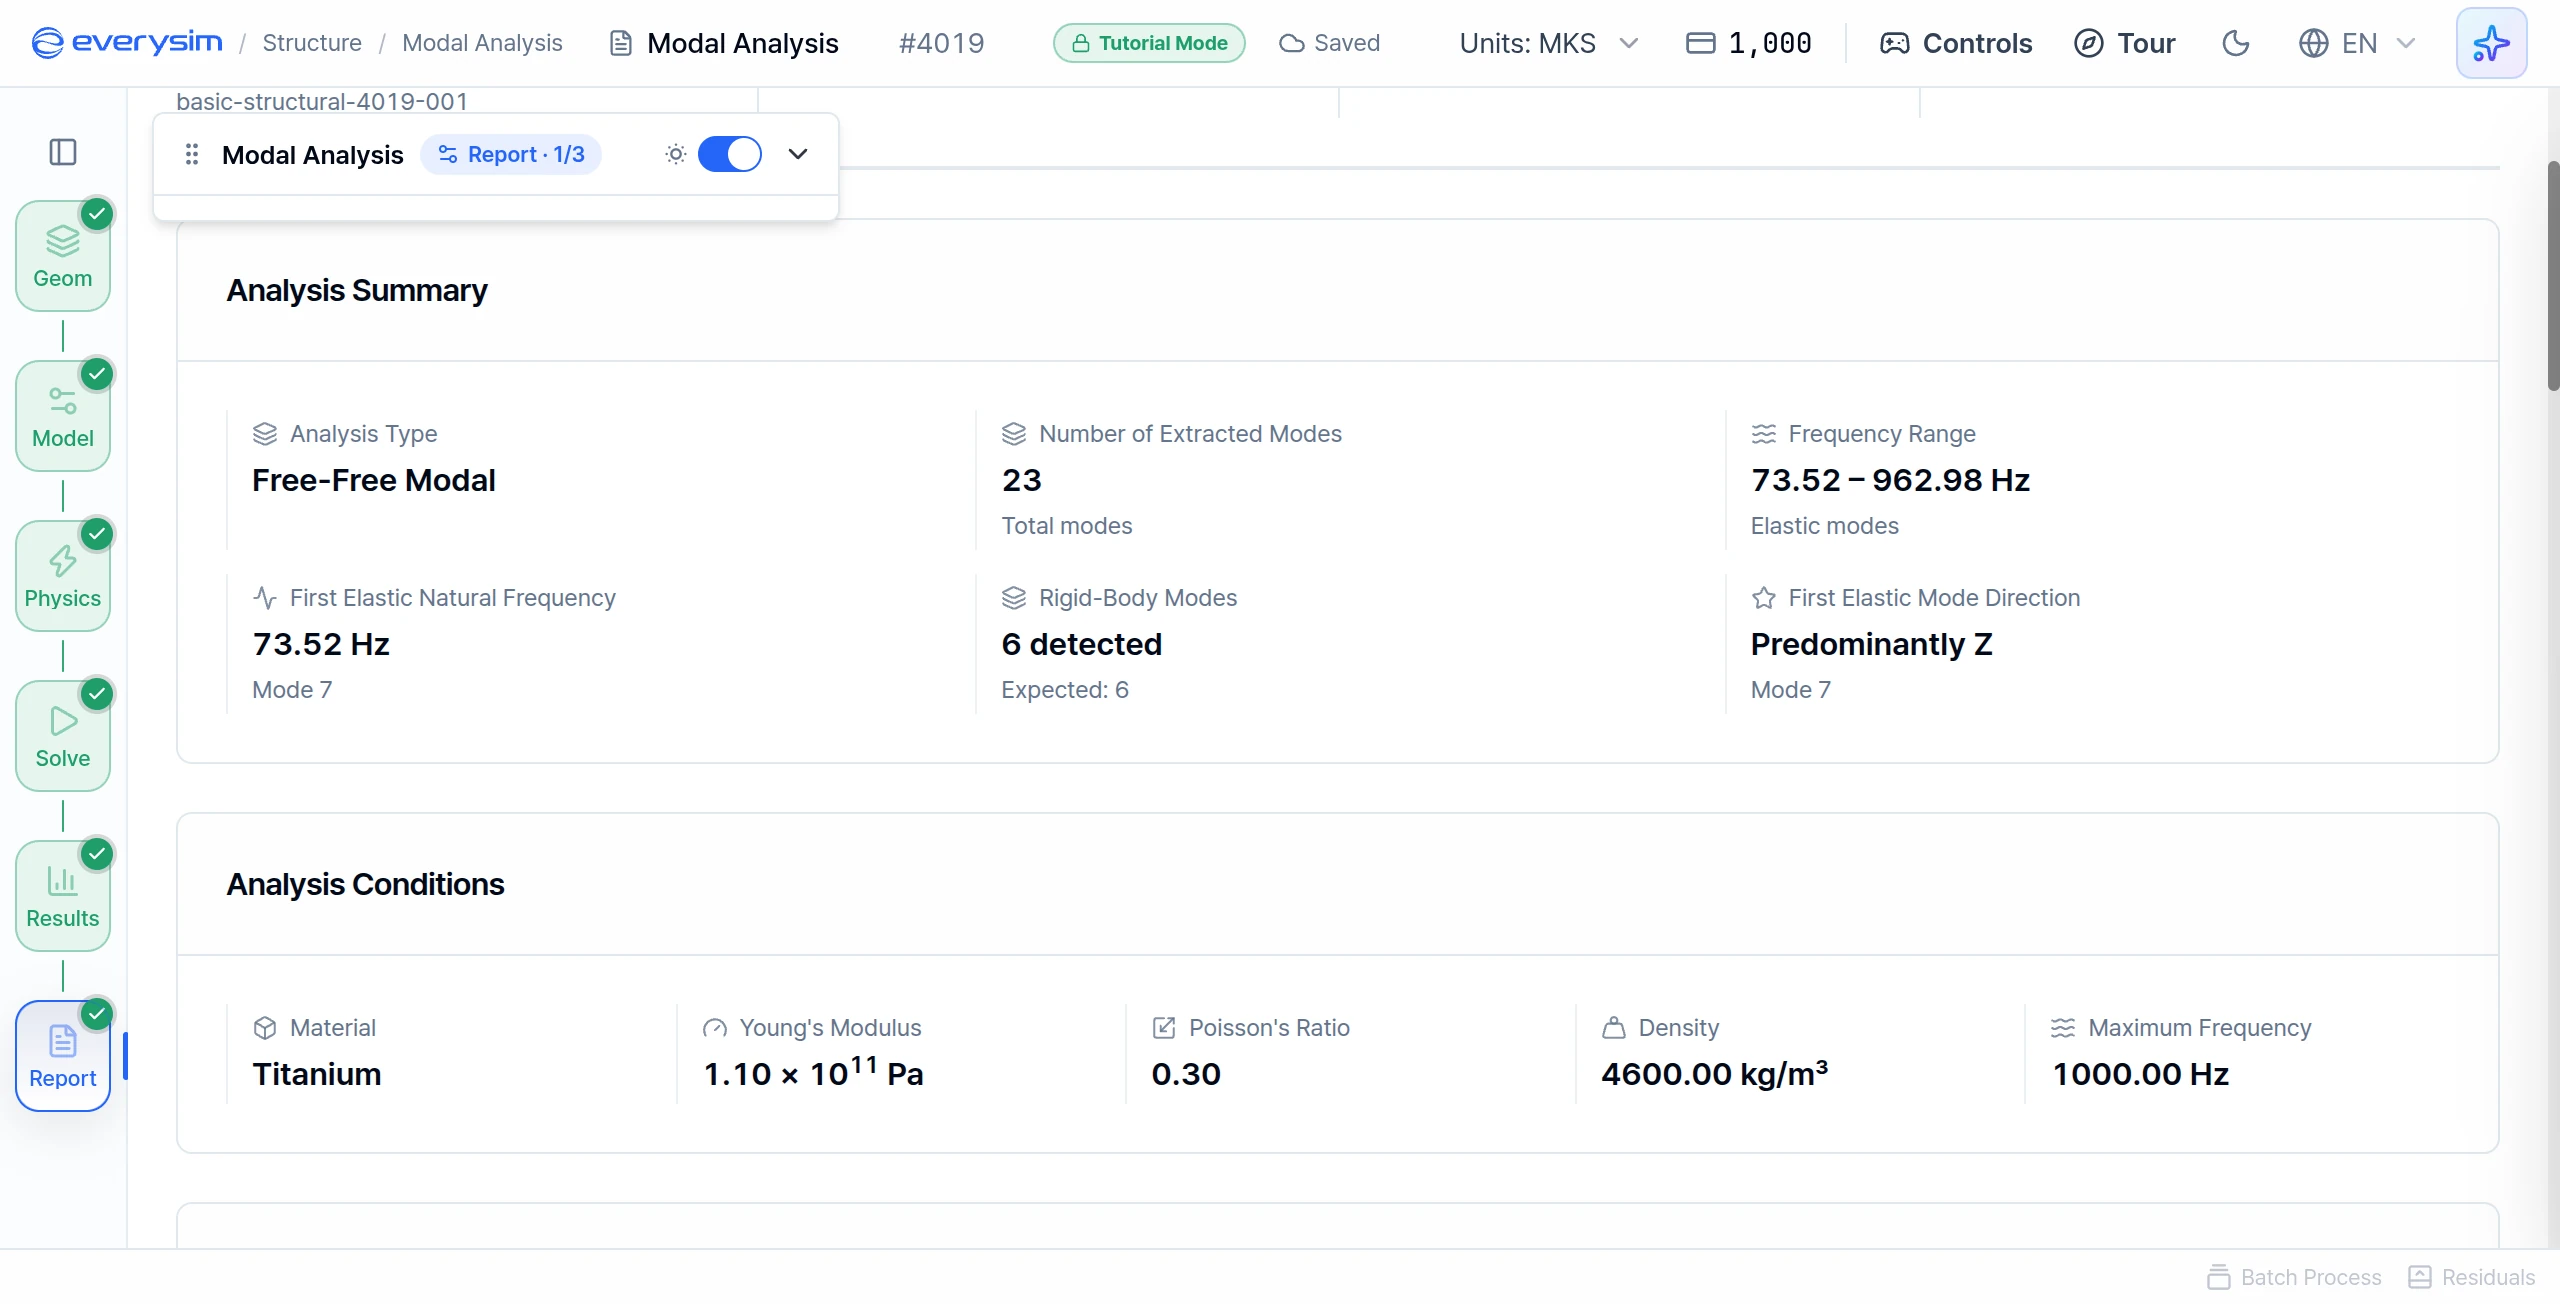
The report starts with a summary of the modes that were found. The prepared result reads:
| Report item | Value |
|---|---|
| Analysis Type | Free-Free Modal |
| Number of Extracted Modes | 23 |
| Frequency Range (elastic modes) | 73.52 – 962.98 Hz |
| First Elastic Natural Frequency | 73.52 Hz (Mode 7) |
| Rigid-Body Modes | 6 detected, expected 6 |
| First Elastic Mode Direction | Predominantly Z |
| Material | Titanium |
| Young's Modulus | 1.10 × 10¹¹ Pa |
| Poisson's Ratio | 0.30 |
| Density | 4600.00 kg/m³ |
| Maximum Frequency | 1000.00 Hz |
The number of extracted modes is how many lie below the maximum frequency. The guide card calls the lowest frequency the fundamental natural frequency. In this Free-Free report, read First Elastic Natural Frequency. Vibration sources should stay well away from it.
15. Frequency Spectrum
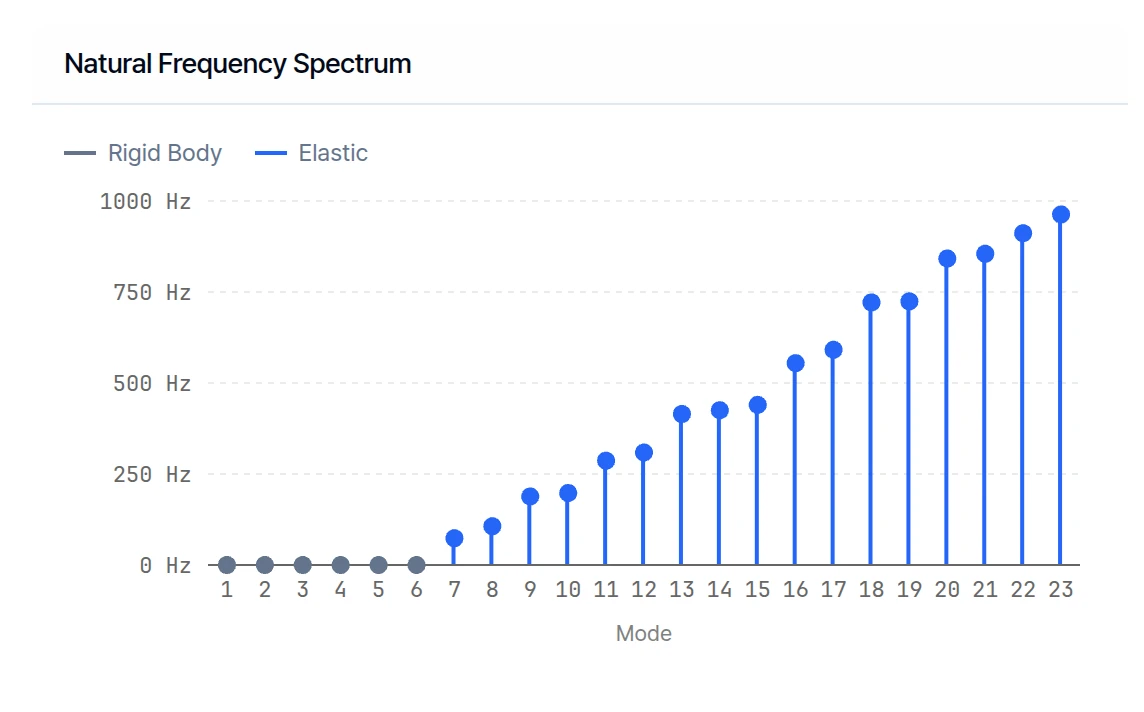
Natural Frequency Spectrum shows one marker per mode at its natural frequency. Modes 1 to 6 sit at 0 Hz as Rigid Body, and Modes 7 to 23 are Elastic.
Look at the spacing. Modes that sit close together can be excited at the same time, and wide gaps are safe ranges for vibration sources.
16. Mode Directionality
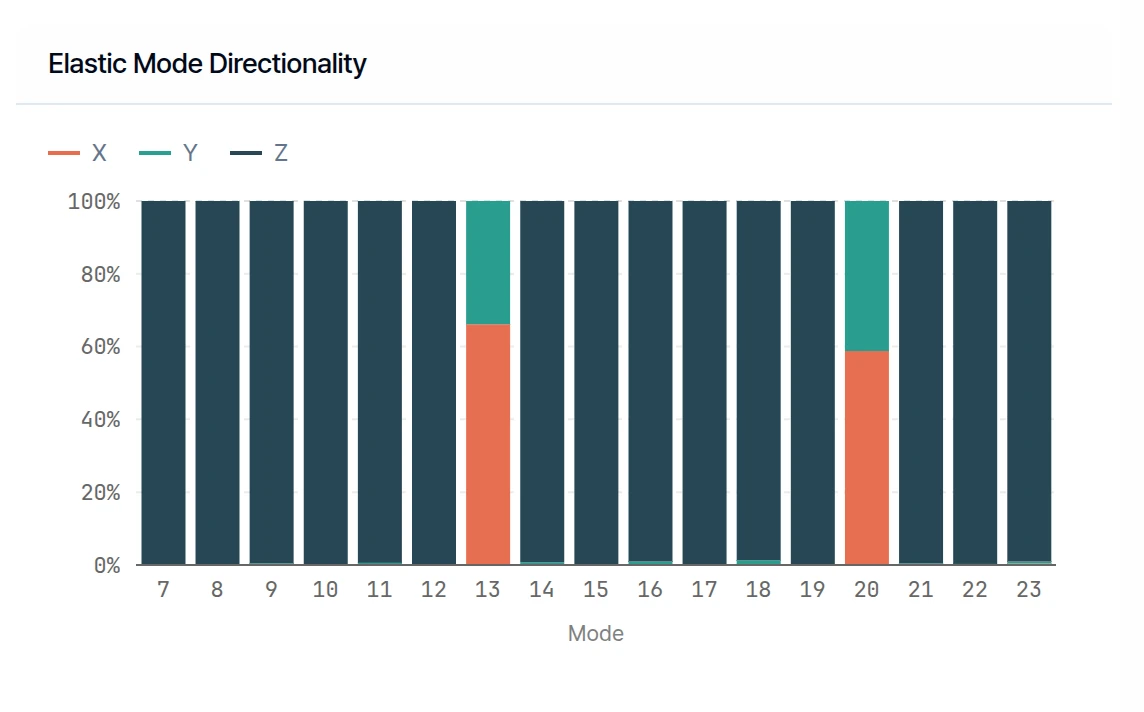
Elastic Mode Directionality splits the motion of each elastic mode across X, Y and Z. Mode 7 is 100% along Z: the wings bend up and down. The dominant direction tells you which way the structure needs stiffening.
Most modes are predominantly Z. The report picks out Mode 13 (414.78 Hz) as the predominantly X mode at 66%, and Mode 20 (841.96 Hz) as the predominantly Y mode at 41%. Directionality describes the orientation of the motion, not modal mass participation.
Press Finish on this page to complete the tutorial. You now know how to find and read the natural frequencies and mode shapes of a structure.
Applying this to your own model
- Compare the elastic natural frequencies with excitation sources such as rotor and motor speeds.
- Check for modes that sit close together.
- Confirm the material and the Free-Free or Constrained assumption match the real structure before relying on the frequencies.
Need Assistance or Have Questions?
Frequently Asked Questions: FAQ Link
Support Inquiries: support@everysim.io