Rapid Aerodynamics Propeller
In this tutorial you test a rotor hovering above an aircraft body with Rapid Aerodynamics, the fast analysis built on the vortex method. The dashboard card shows this tutorial as Vortex Propeller. You build the propeller from an airfoil, try its placement controls, check the hover conditions, then read the wake and the performance report. It takes about 10 minutes.
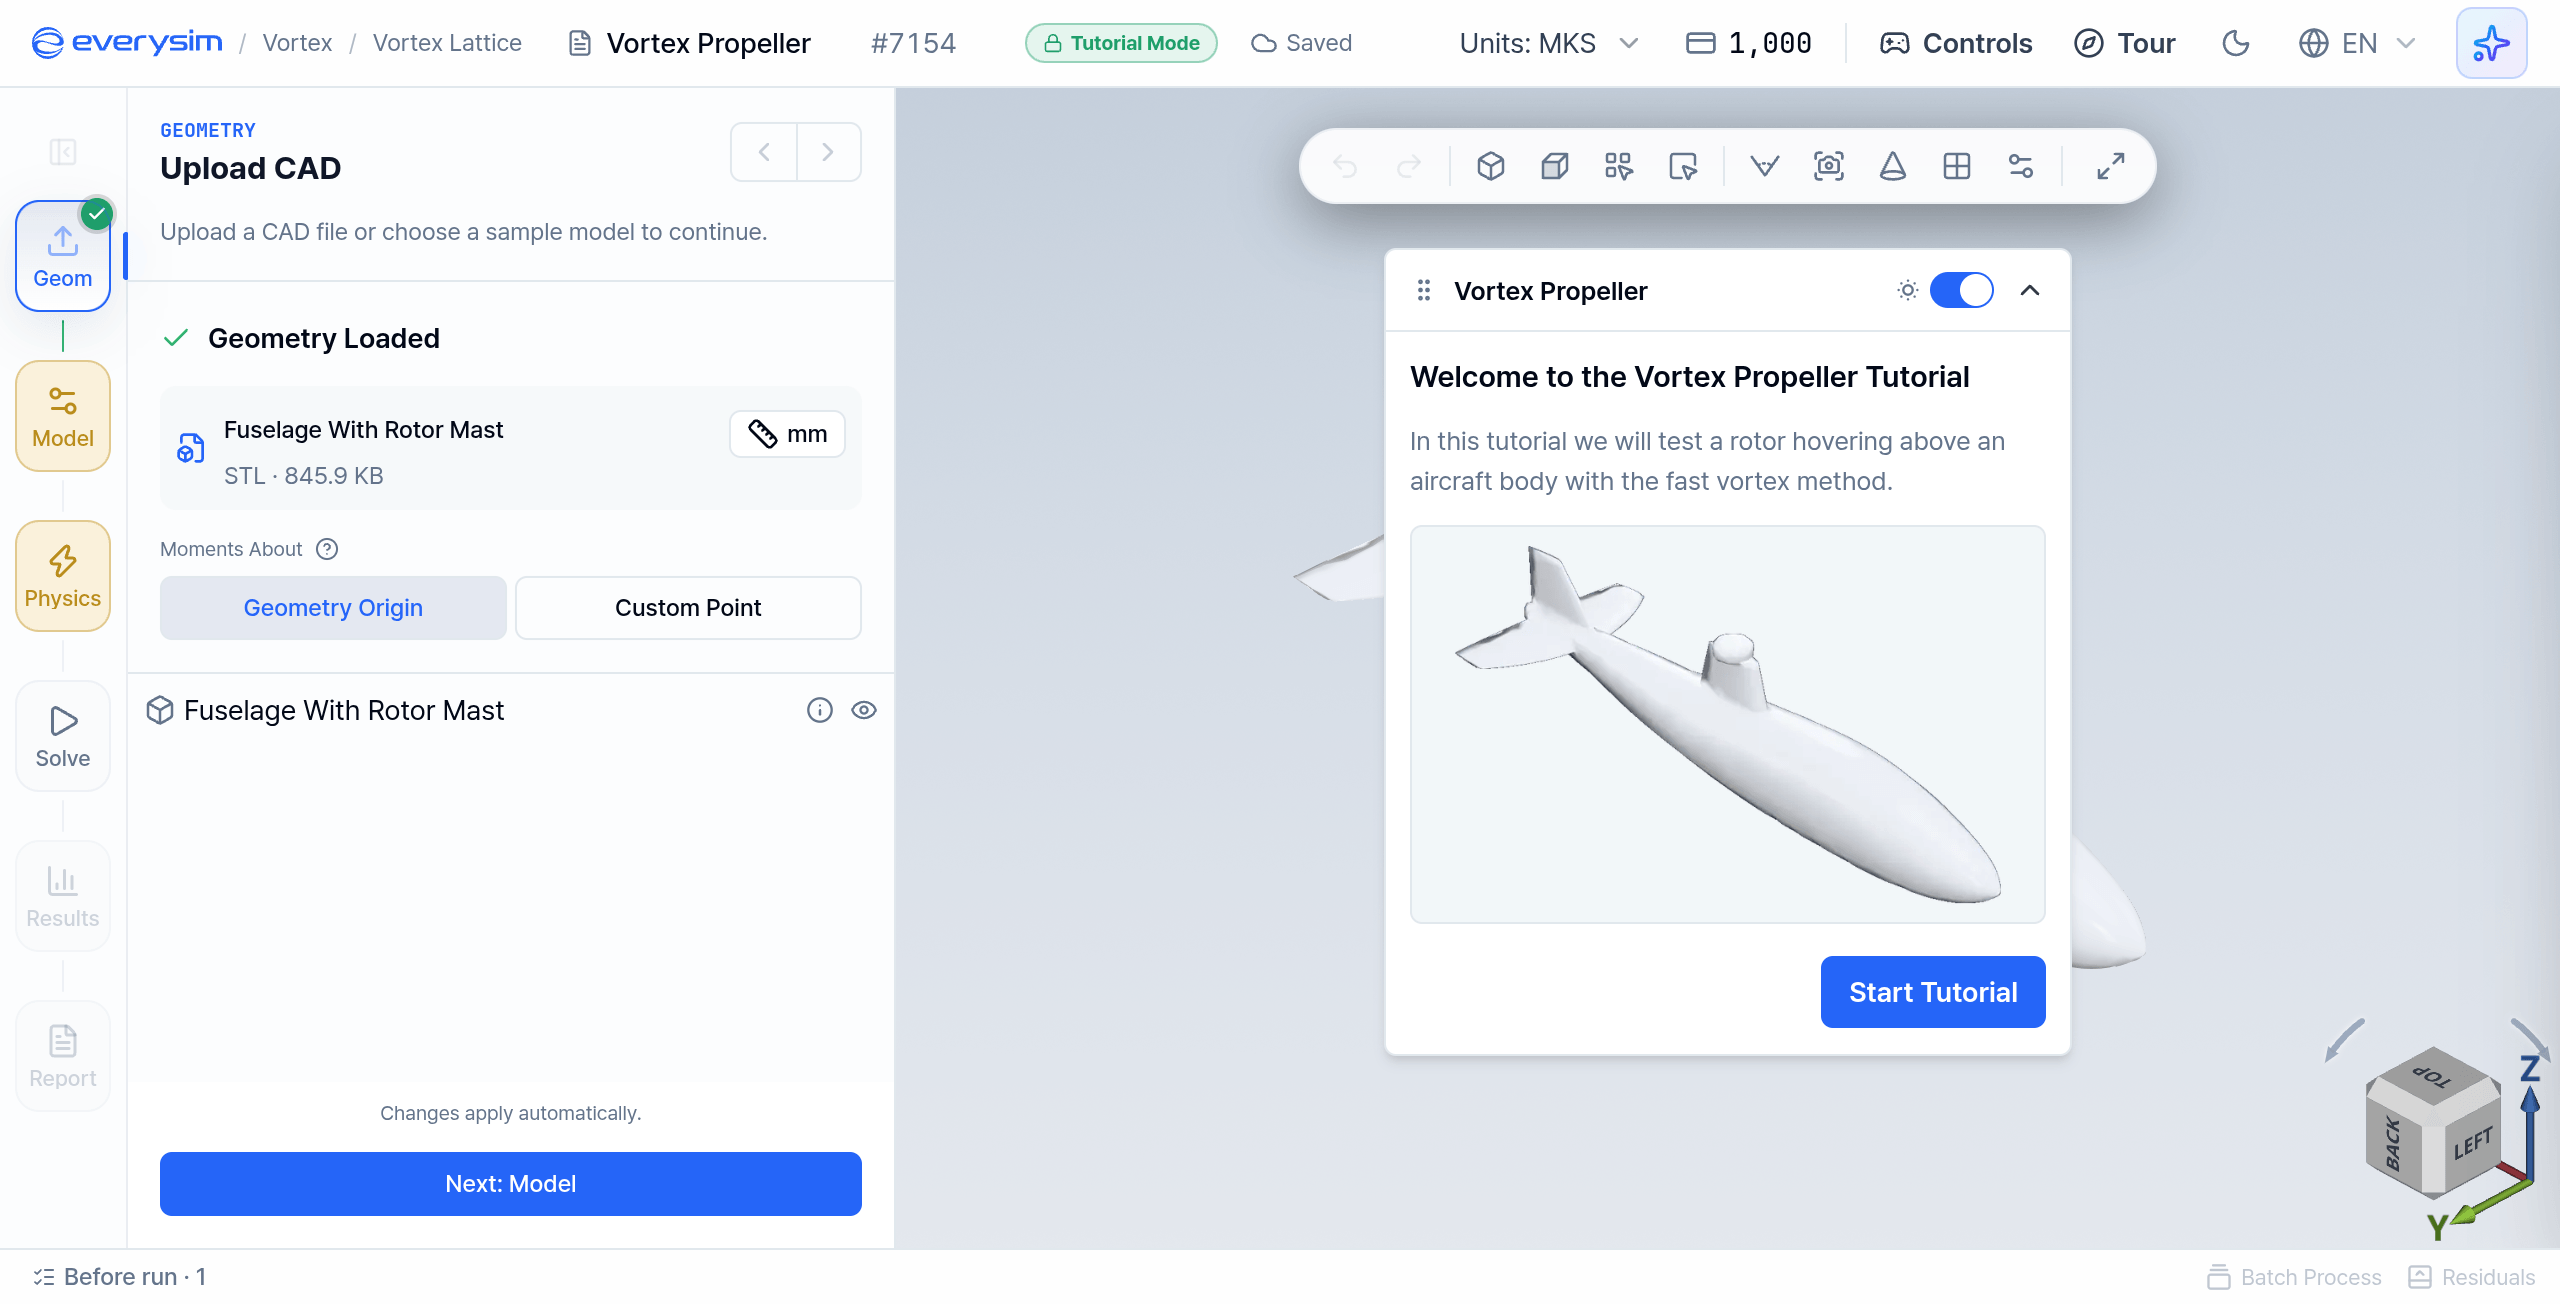
The tutorial's conditions are fixed, because they are the ones its prepared result was computed with:
| Setting | Value |
|---|---|
| Sample model | Fuselage With Rotor Mast.stl, a fuselage with a rotor mast on top |
| Airfoil | NACA 0015 |
| Blade Count | 2 |
| Rotation Speed | 4,000 RPM (tip speed about 157 m/s) |
| Propeller Diameter | 0.75 m (tip radius 375 mm) |
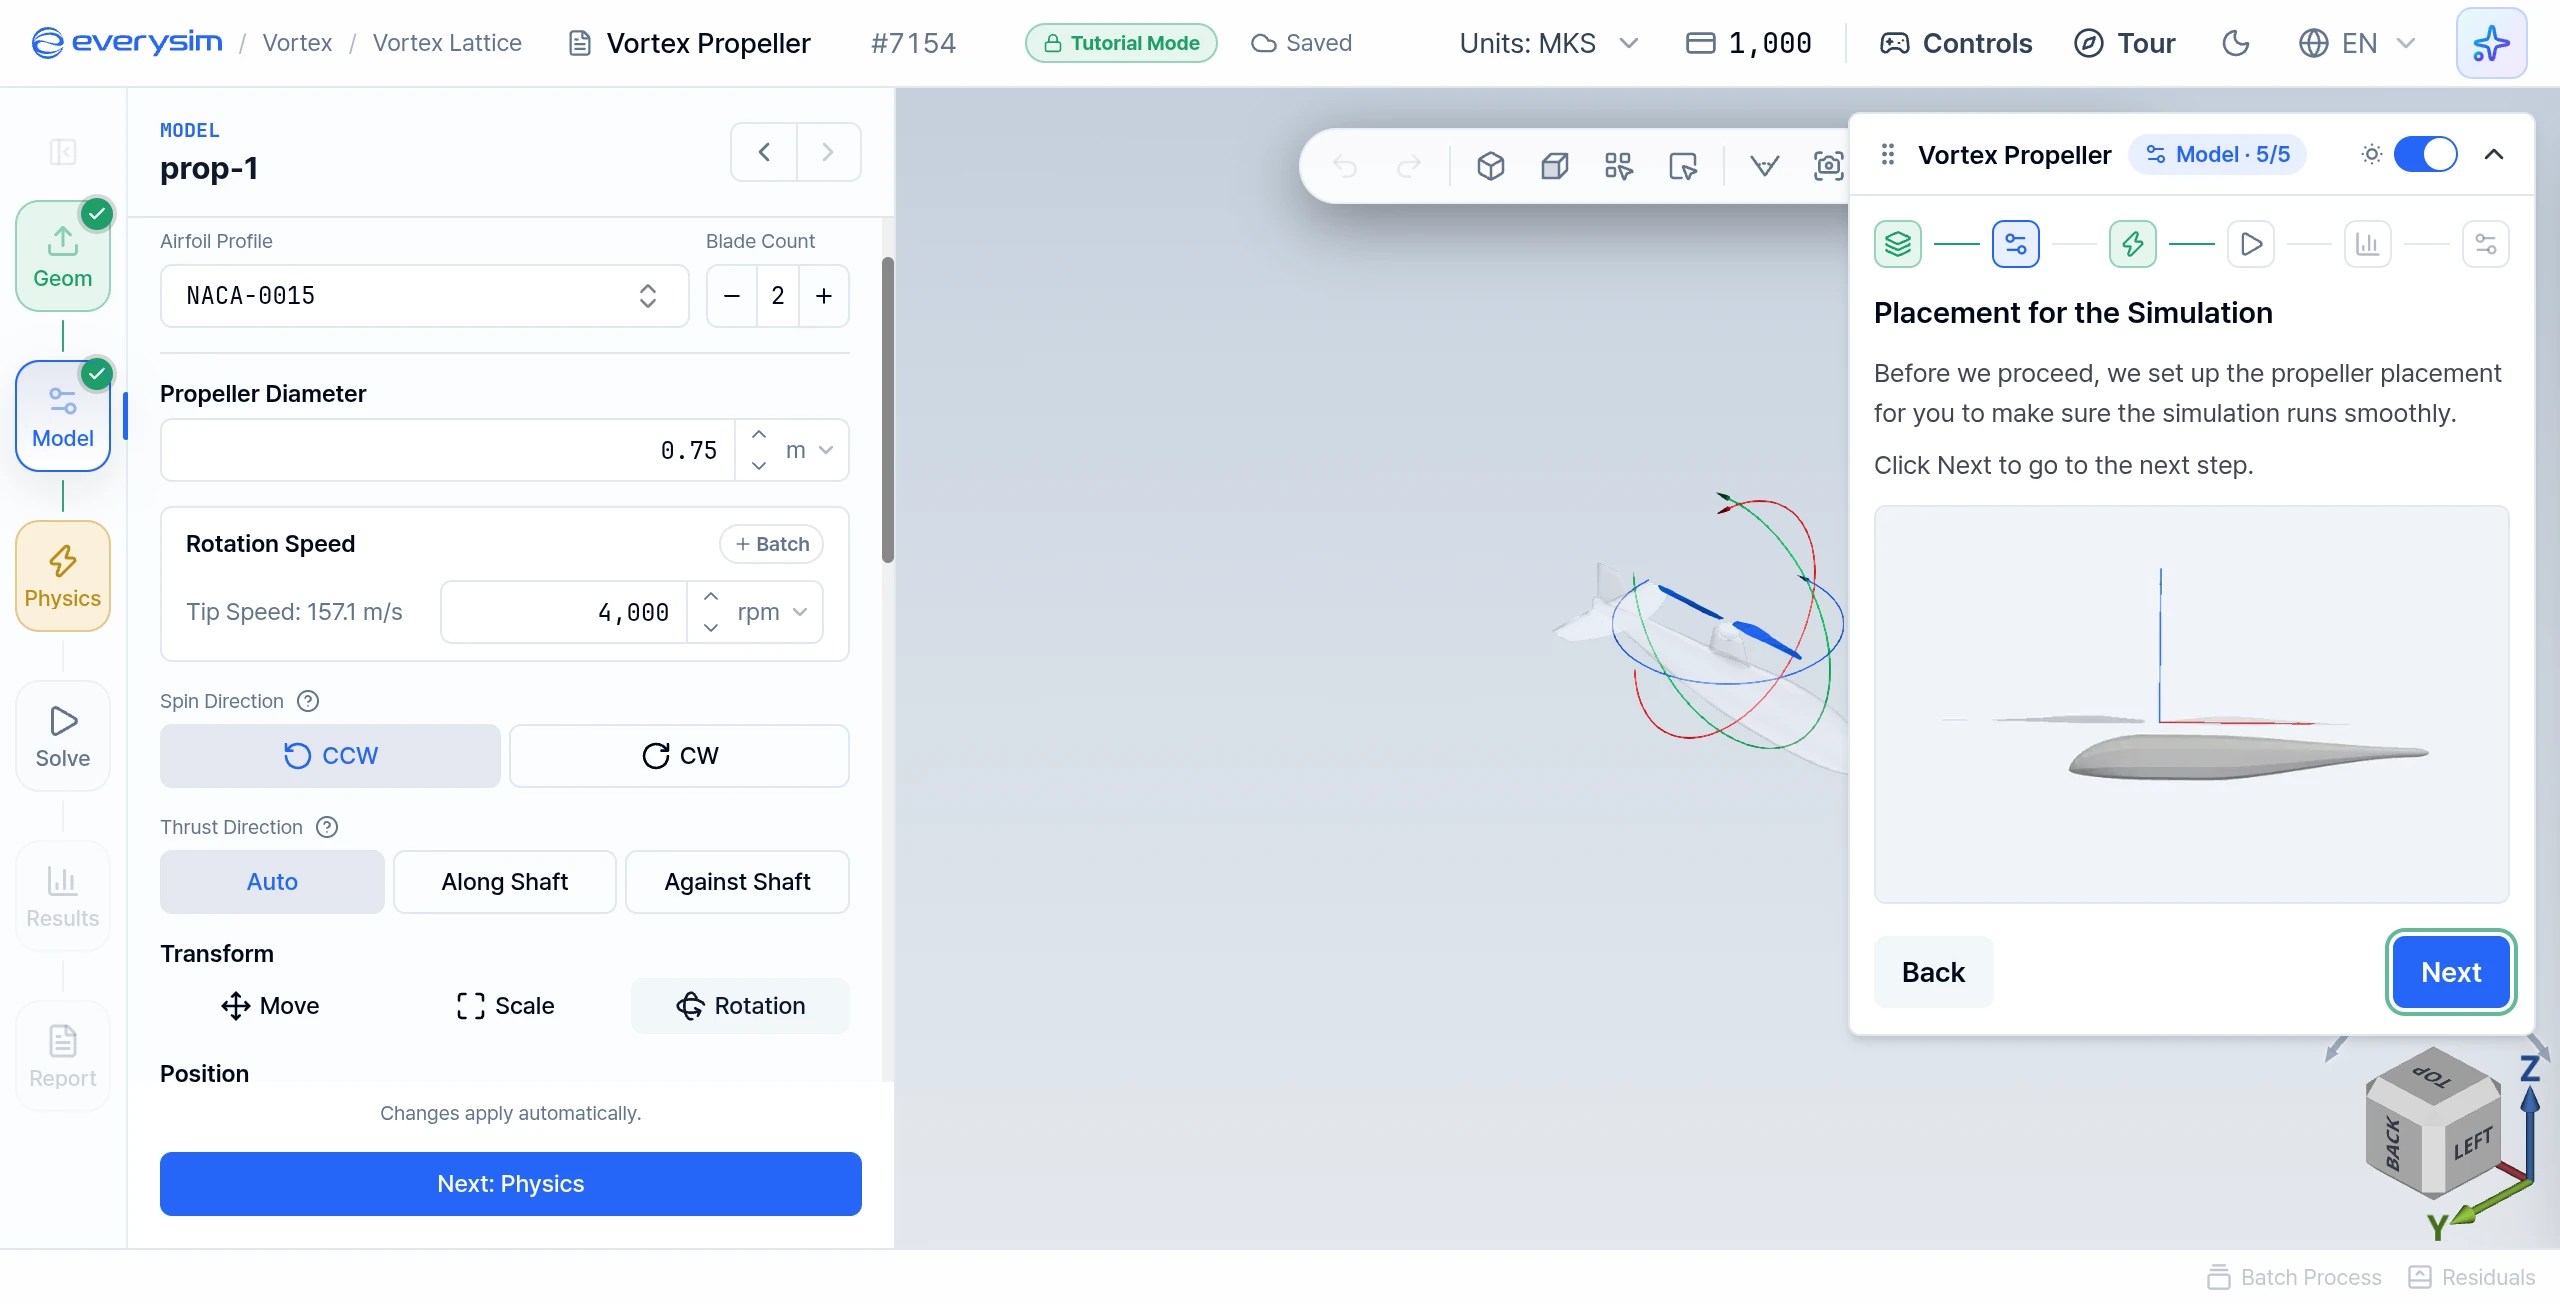
| Placement | Set by the tutorial, above the rotor mast, at Z = 0.285 m |
| Wind Speed | 0 m/s (hover) |
A tutorial's Run Simulation does not submit a solver job. The simulation card shows a run for about 3 seconds, then a result computed in advance opens. Every reader sees the same result.
Open Tutorials from the sidebar and click the Vortex Propeller card. The welcome card opens first. Press Start Tutorial, and three Before You Start pages explain the highlights, the task list and how to stop and resume. The guide card then lists the tasks for each page. See How guidance works for the highlights and the Next button.
1. Geometry
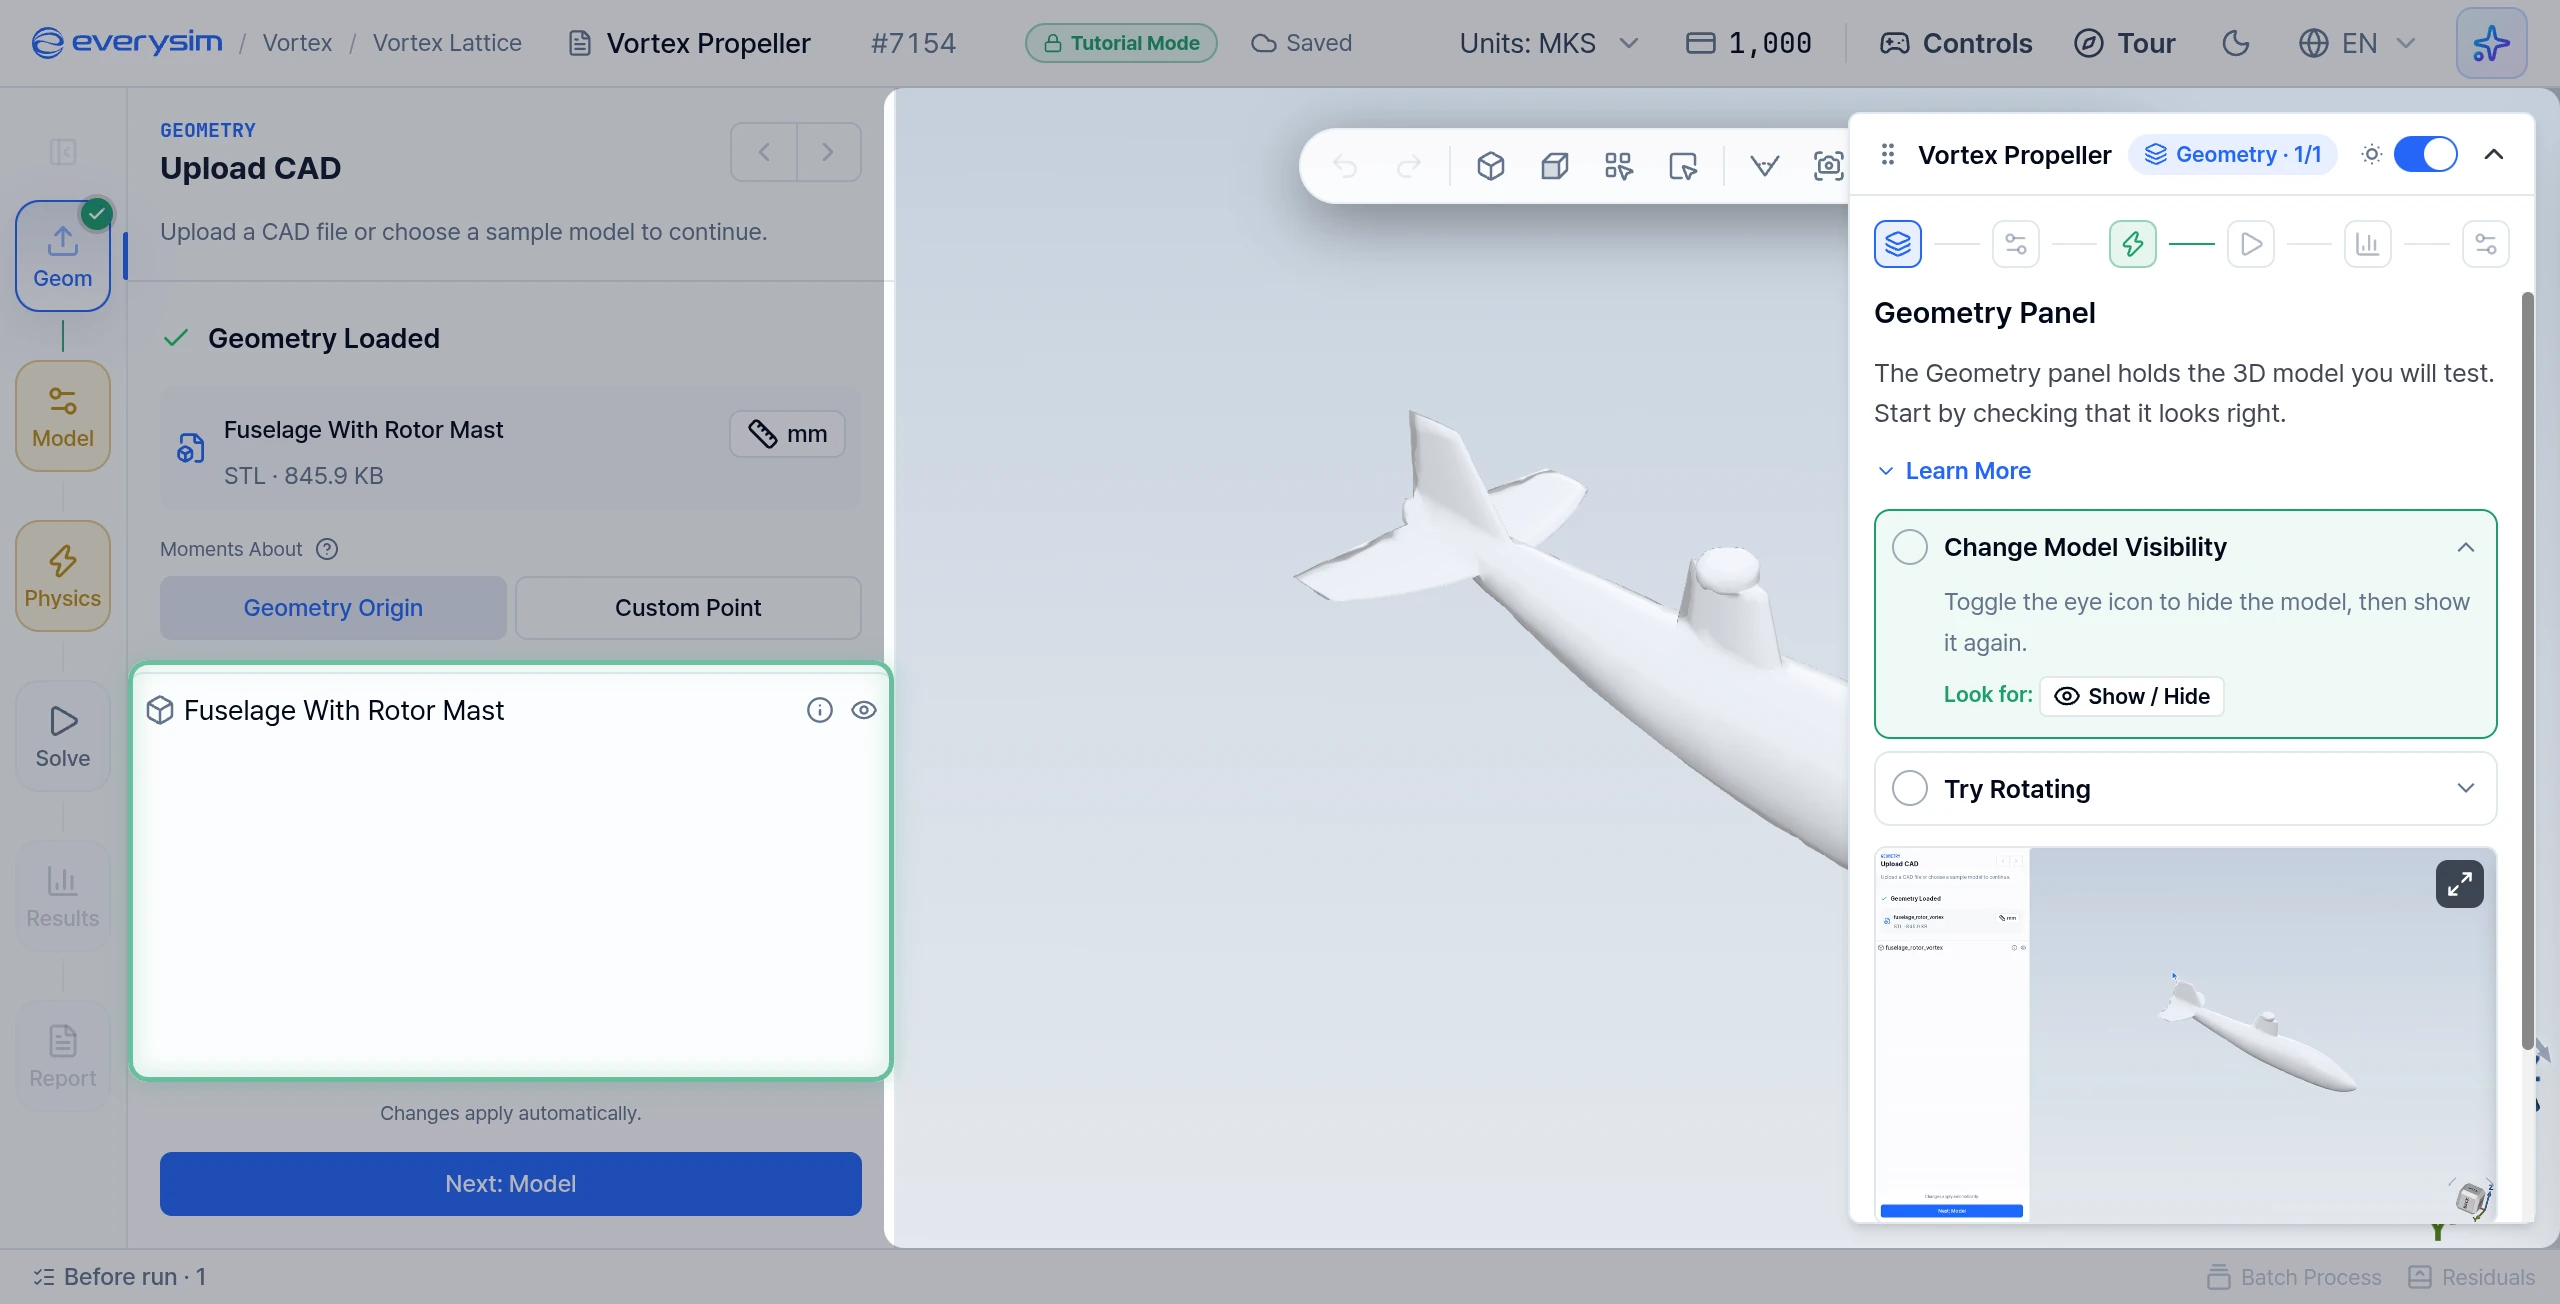
Geometry Panel
The Geometry panel holds the 3D model you will test. Start by checking that it looks right.
- Change Model Visibility: toggle the eye icon to hide the model, then show it again.
- Try Rotating: drag in the 3D viewport to rotate the model.
Click Next.
2. Model
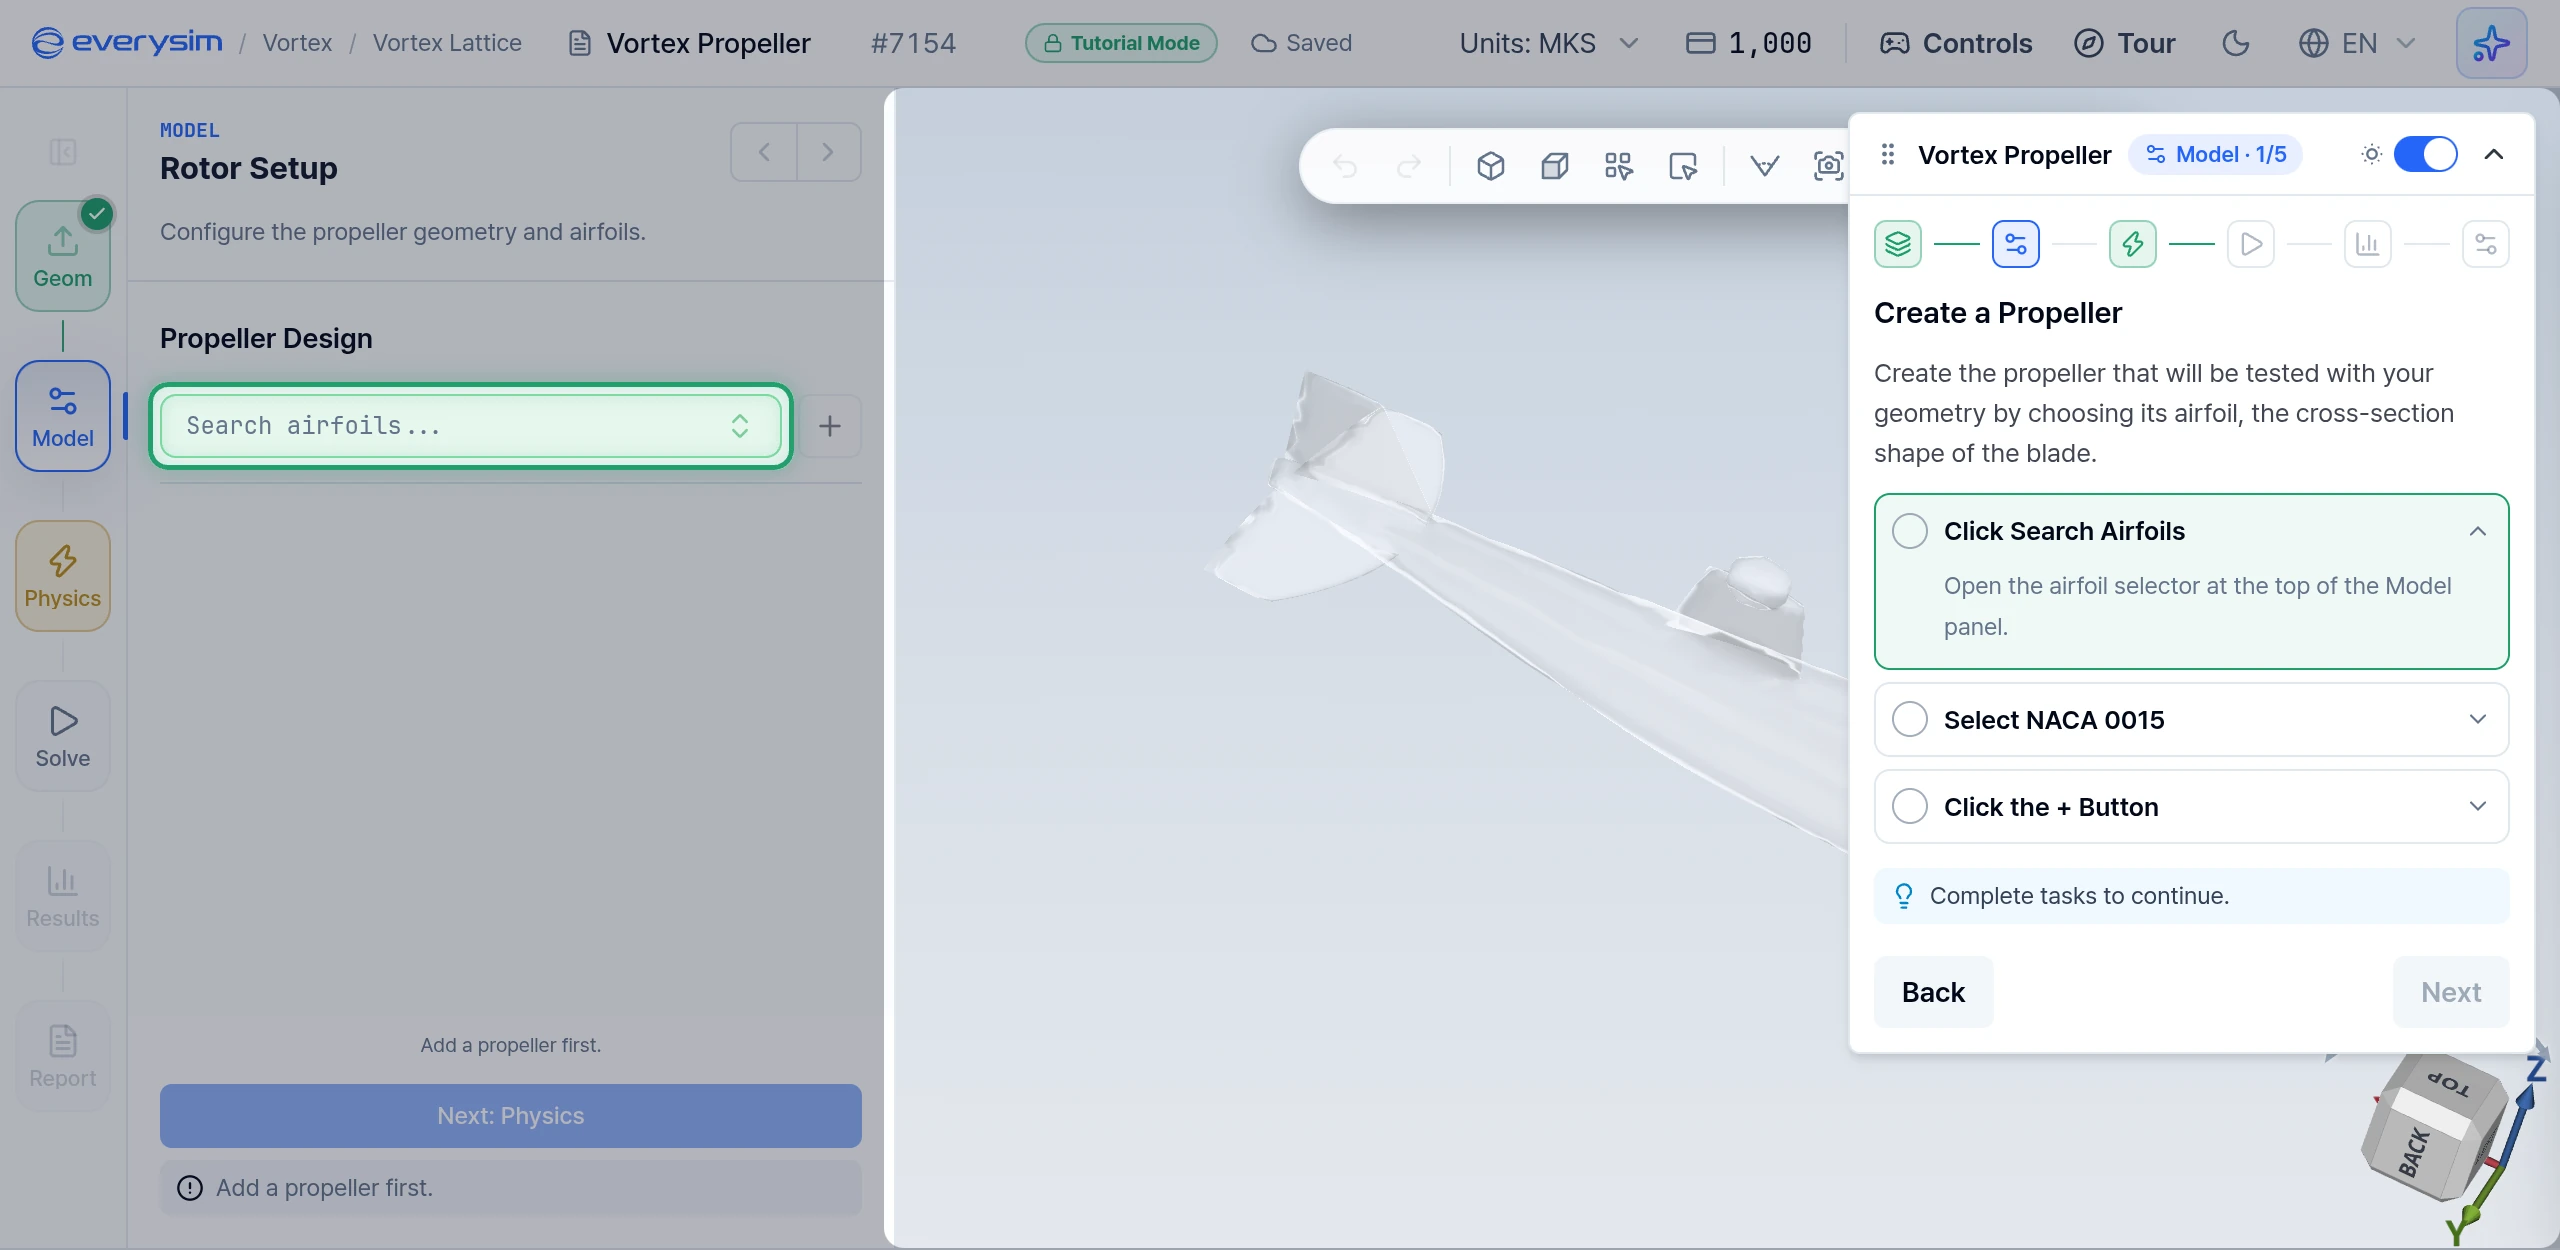
Create a Propeller
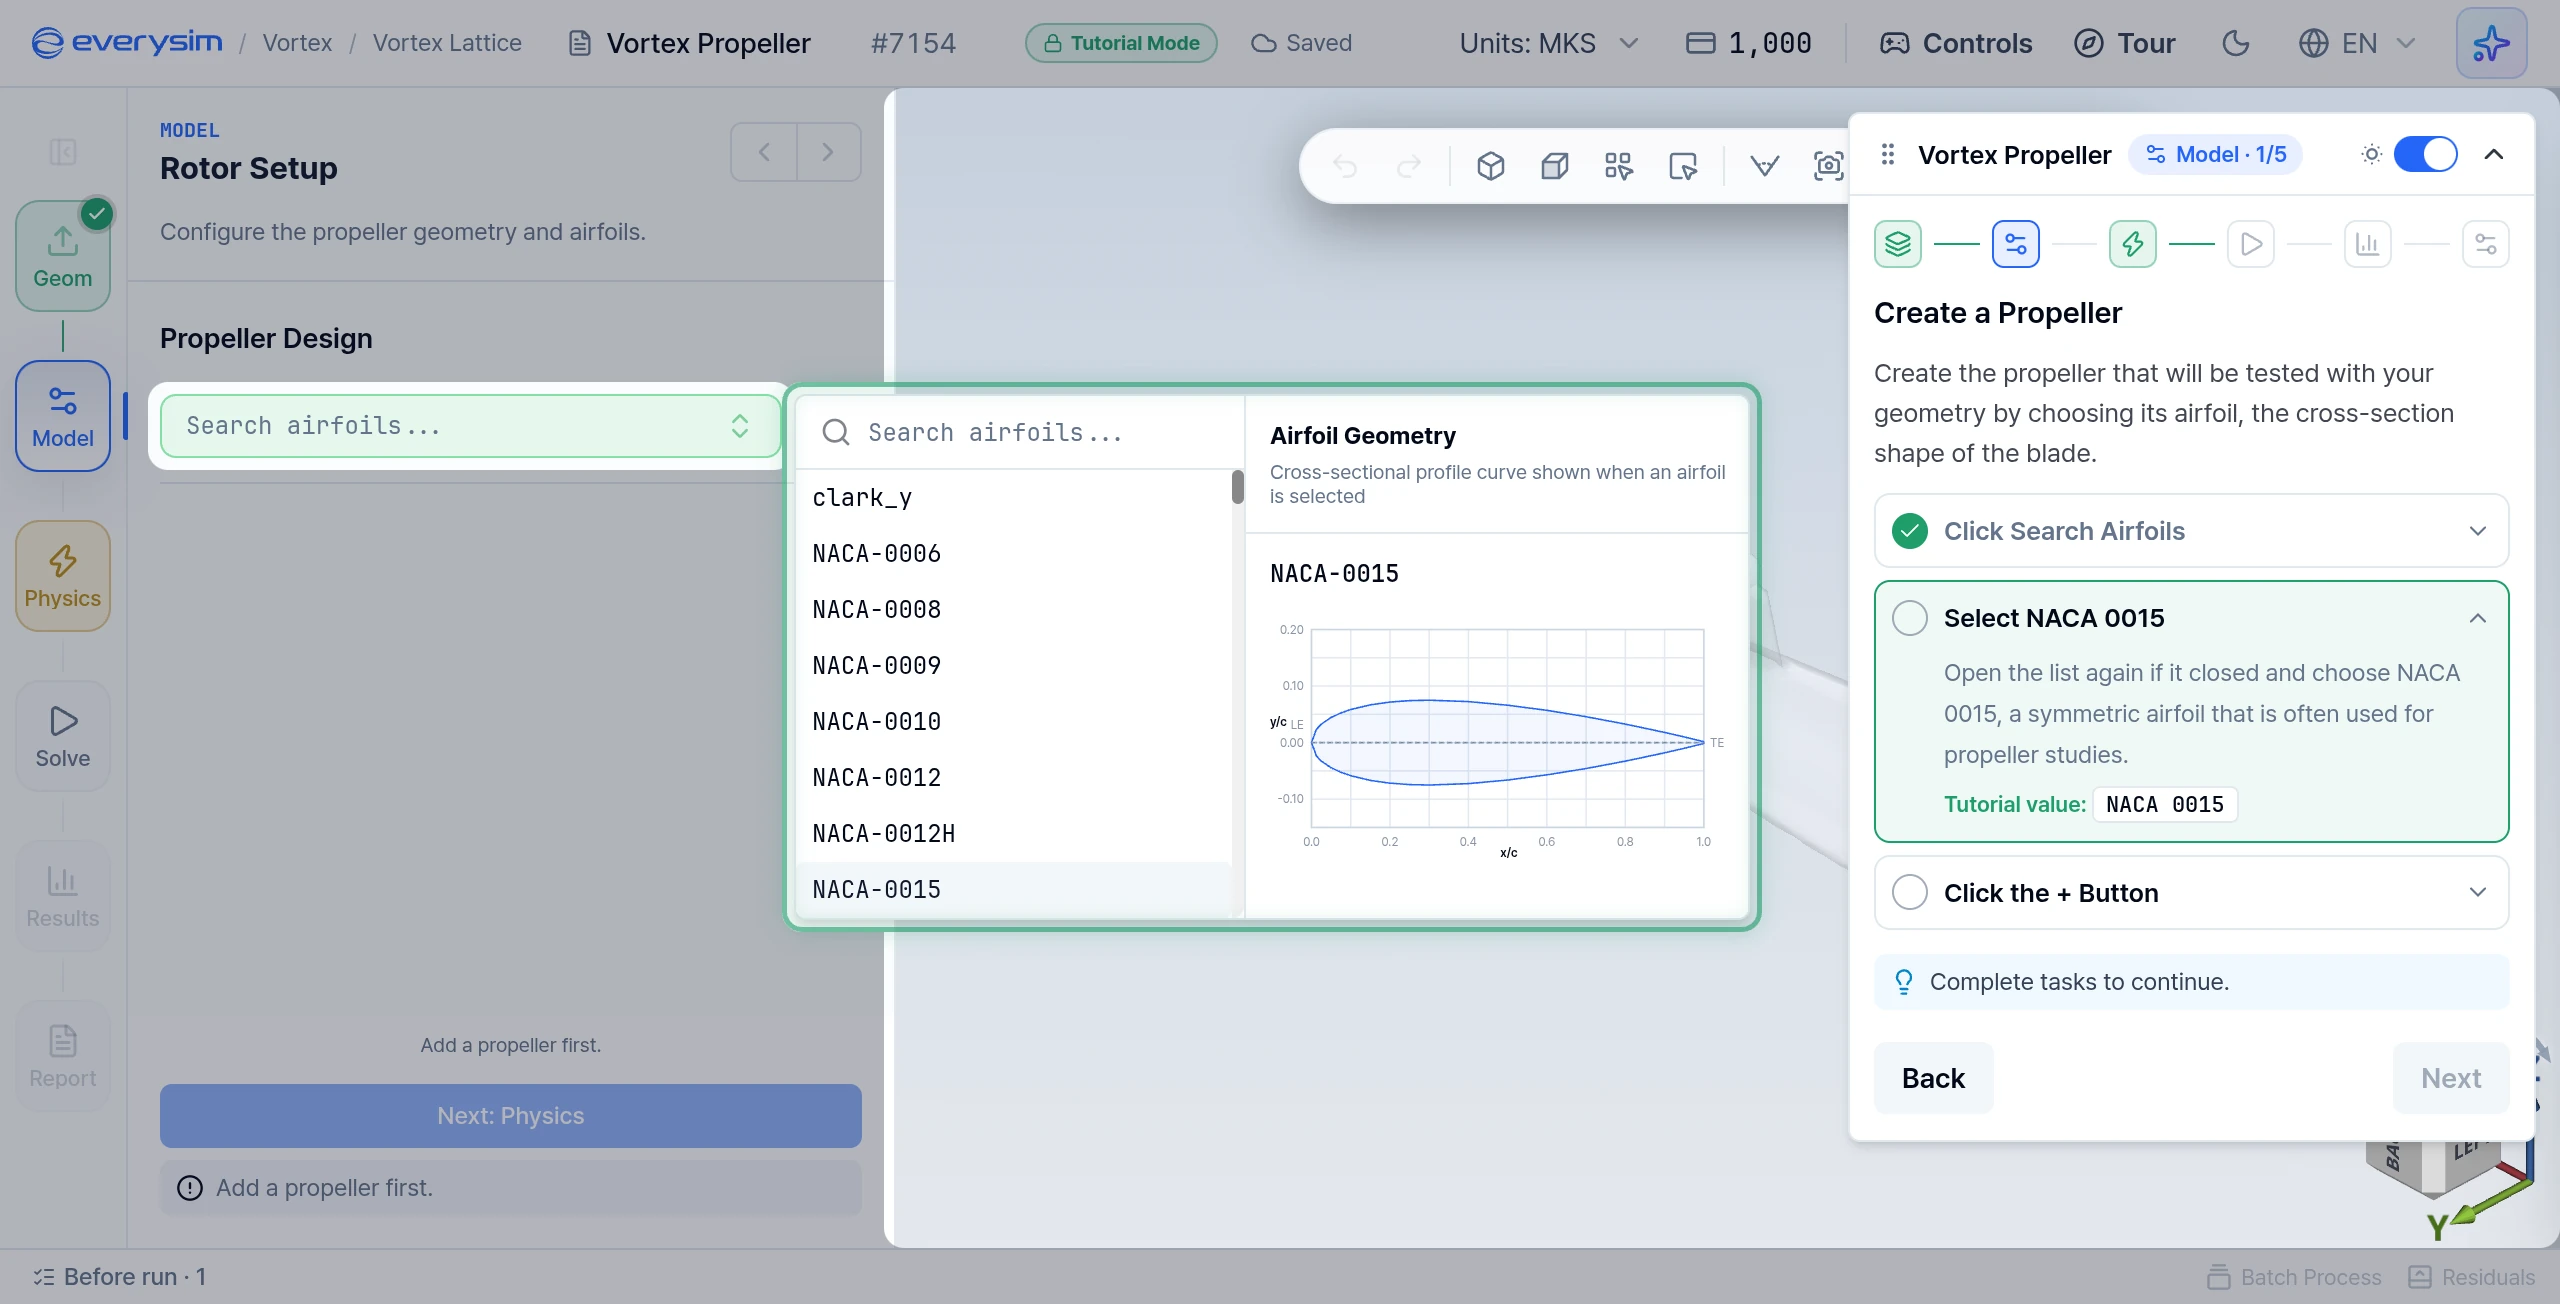
Create the propeller by choosing its airfoil, the cross-section shape of the blade.
- Click Search Airfoils: open the airfoil selector at the top of the Model panel.
- Select NACA 0015: open the list again if it closed, then choose NACA 0015. It is a symmetric airfoil often used for propeller studies. The propeller list shows it as
NACA-0015. - Click the + Button: click + next to the selector. The propeller is named automatically and appears in the viewport and in the propeller list.
Click Next.
Propeller Test Settings
You will rotate the propeller and see how much wake it produces over the geometry. The wake is the swirling, disturbed air a propeller leaves behind.
- Open the Detail Settings: click the gear button (Detail Settings) next to the propeller in the list.
Click Next.
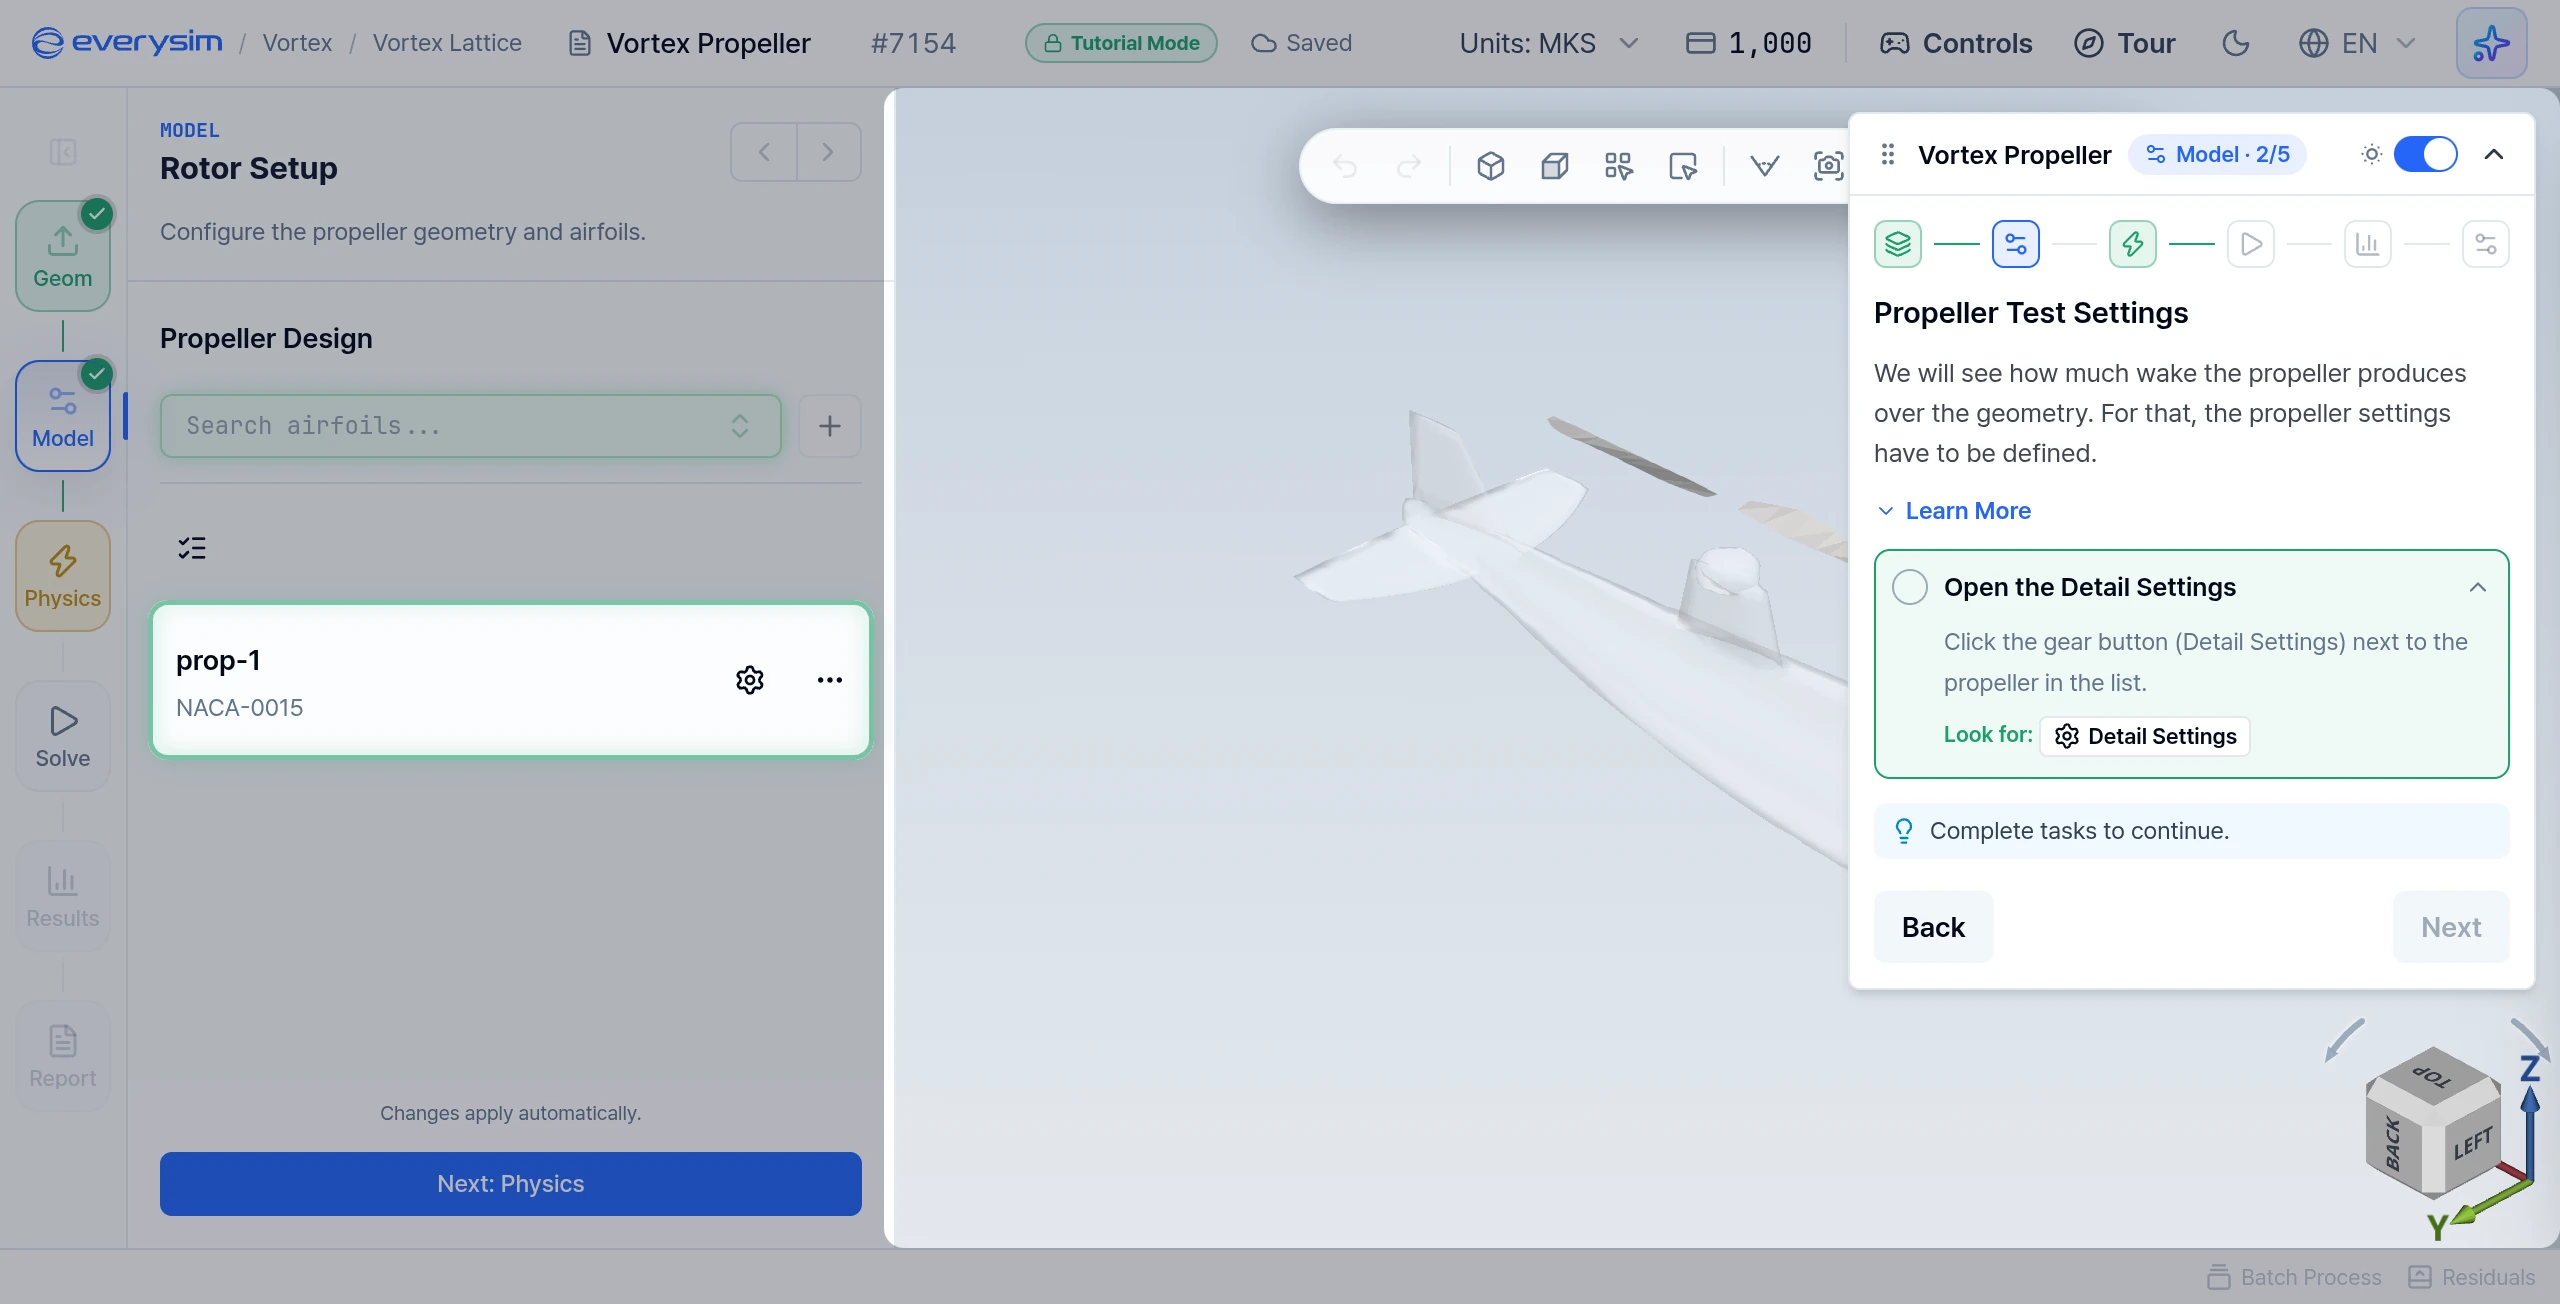
The gear opens the propeller's settings: Airfoil Profile, Blade Count, Propeller Diameter, Rotation Speed, Spin Direction, Thrust Direction, Transform and the Sections table. The new propeller starts with a diameter of 0.75 m.
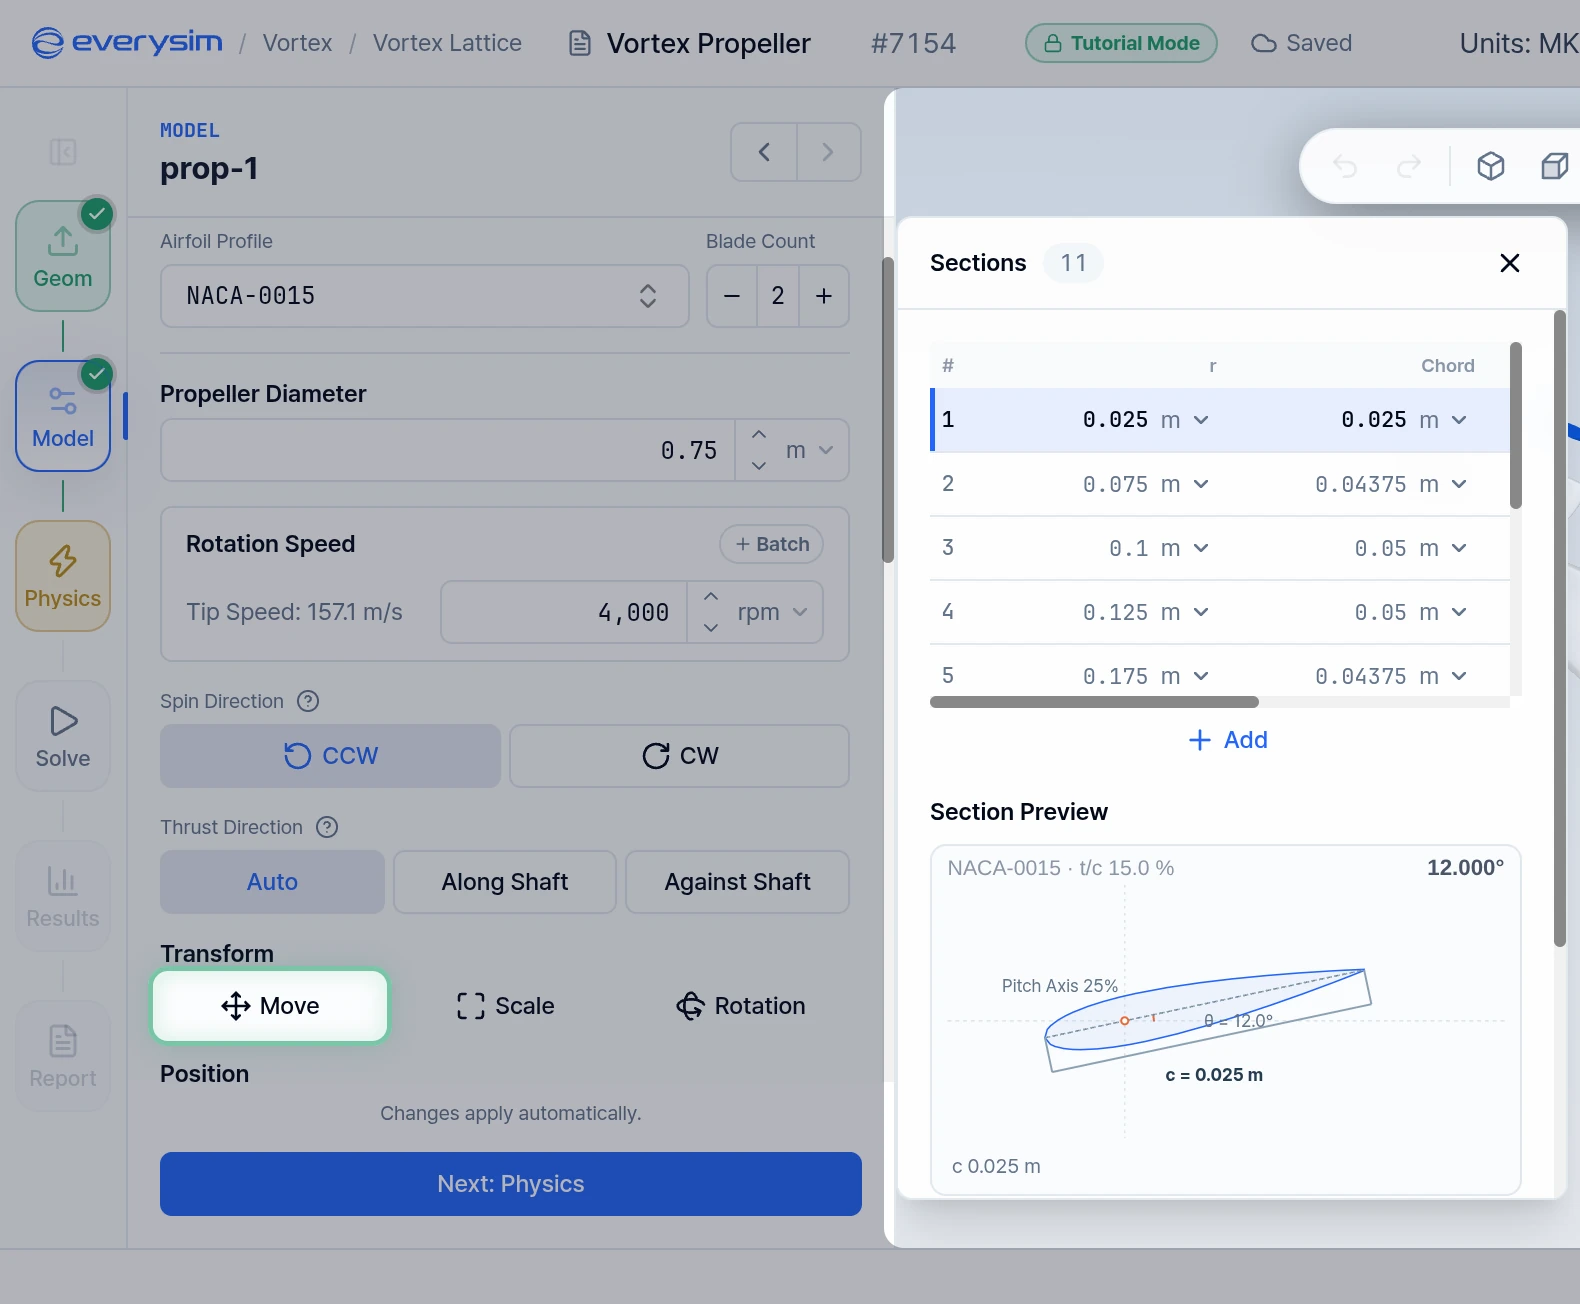
Rotation Speed
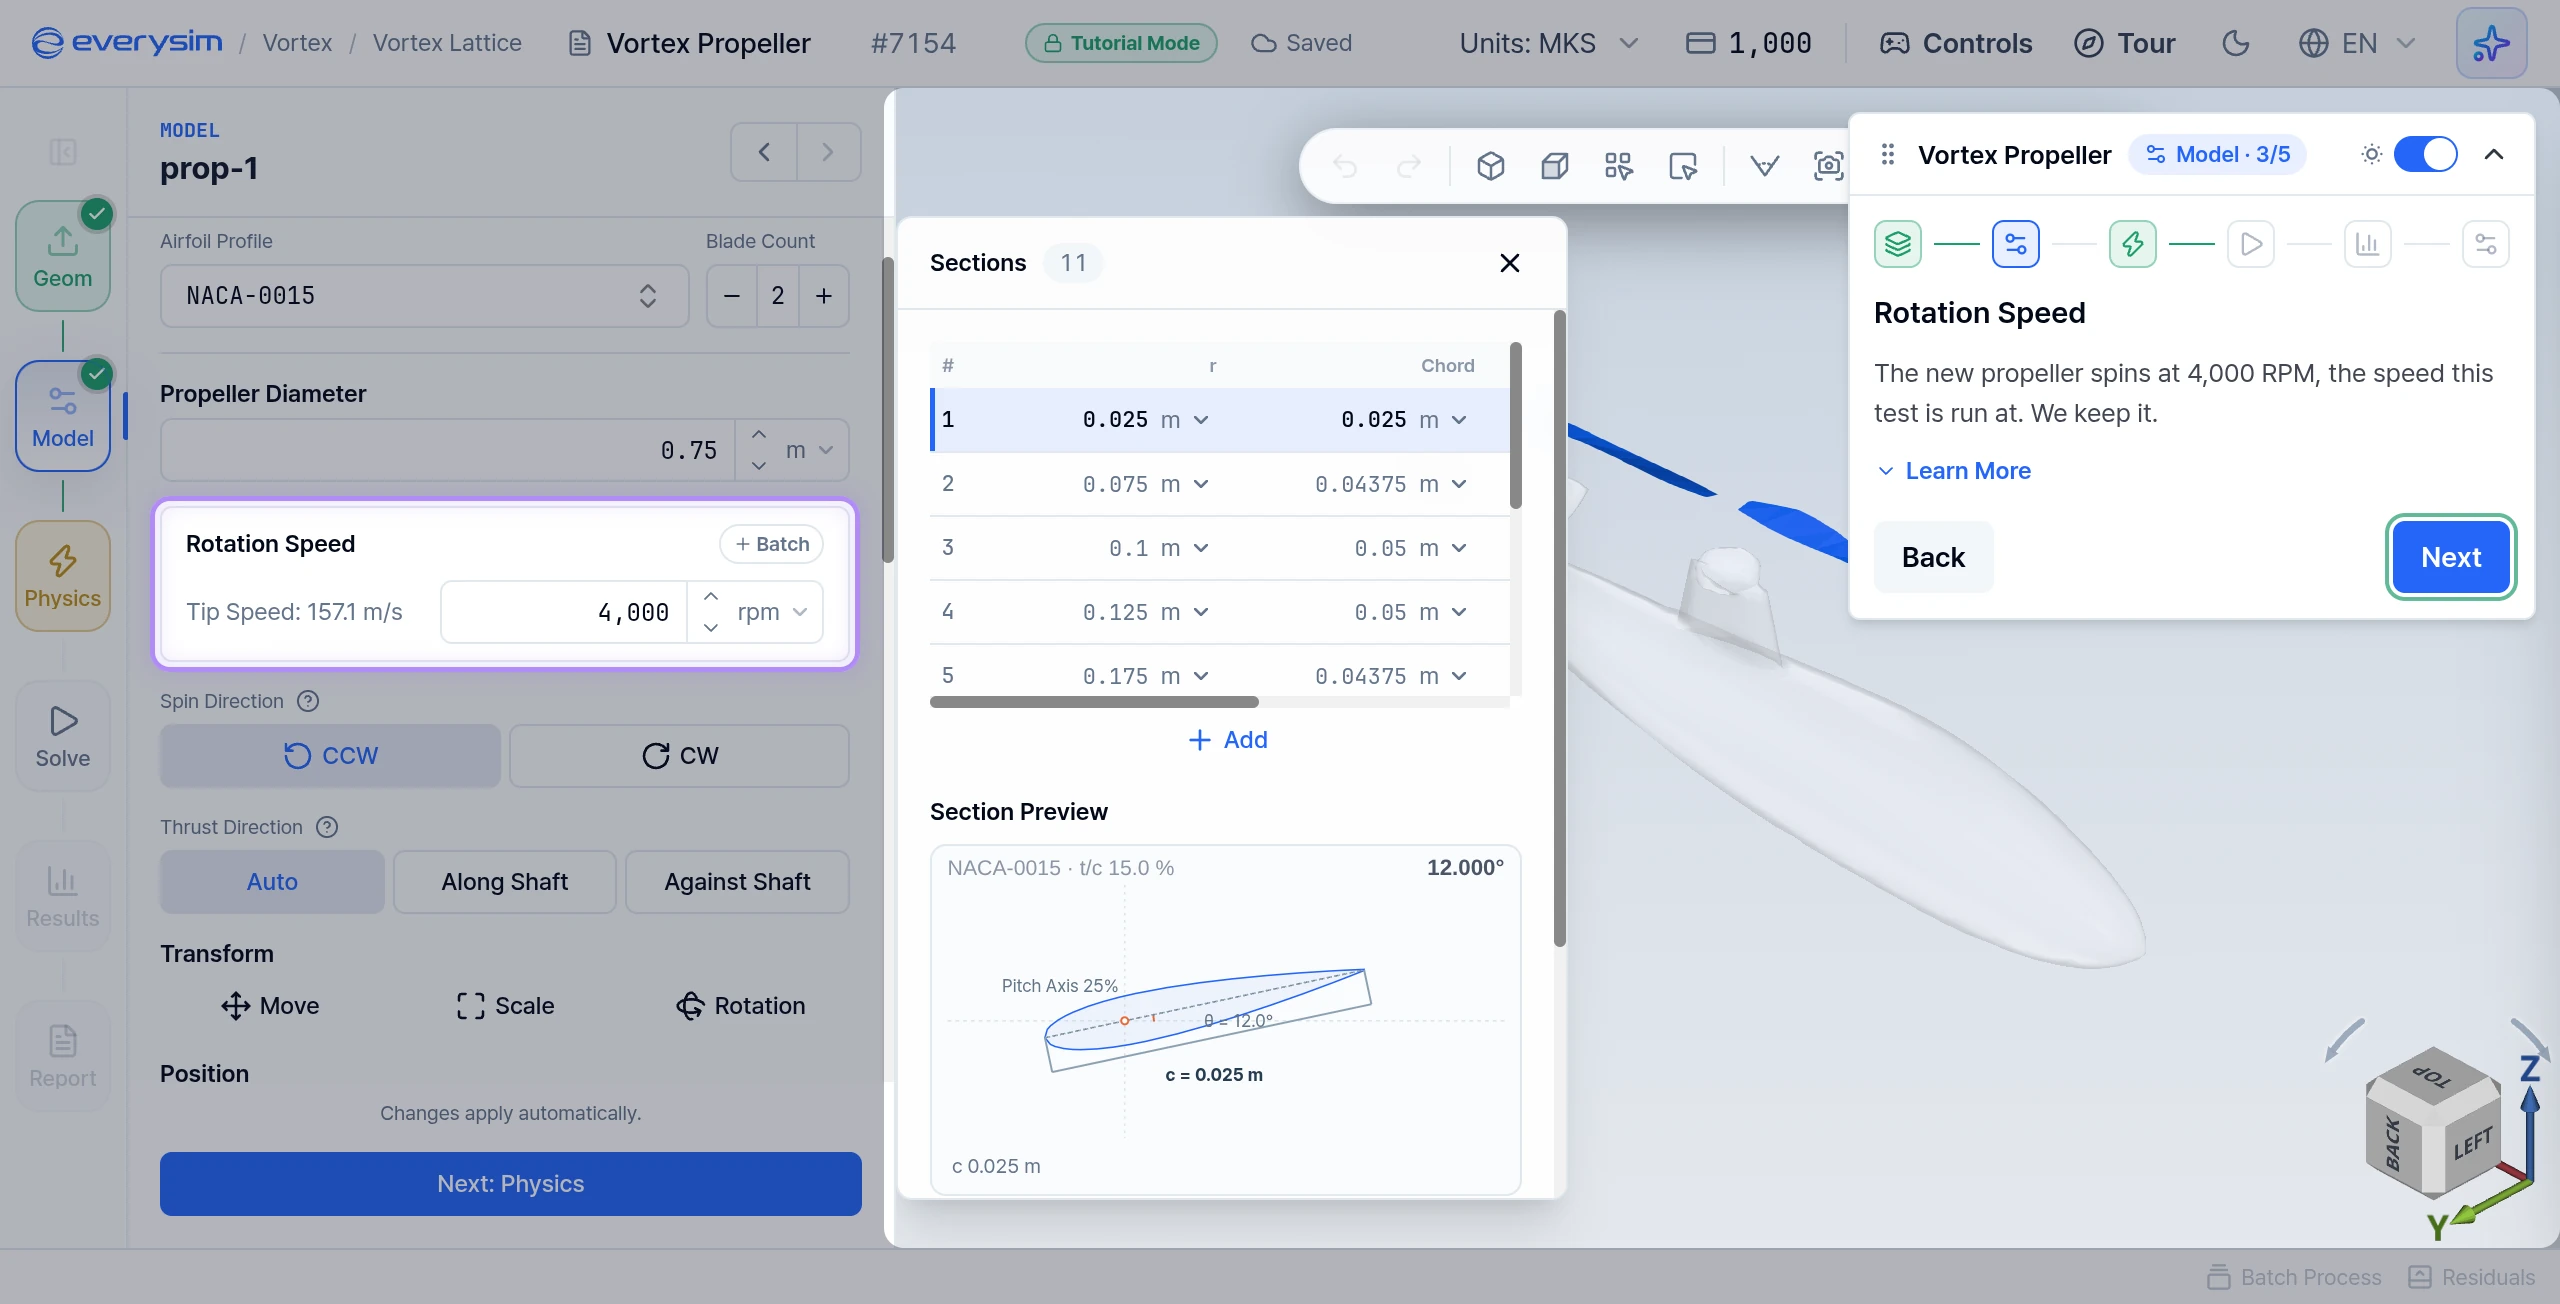
This page has no task. The new propeller spins at 4,000 RPM, the speed this test is run at, so keep it.
At 4,000 RPM the blade tips move at about 157 m/s, shown as Tip Speed: 157.1 m/s. The faster a rotor spins, the more thrust it makes, and the more power it takes to turn.
Click Next.

Propeller Placement
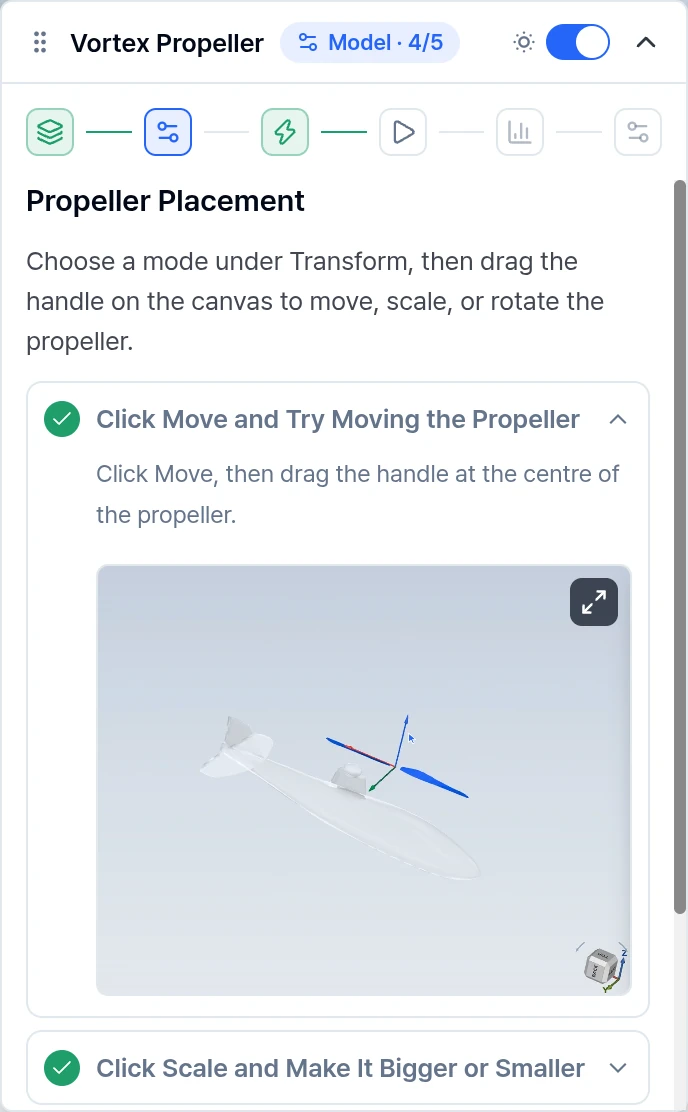
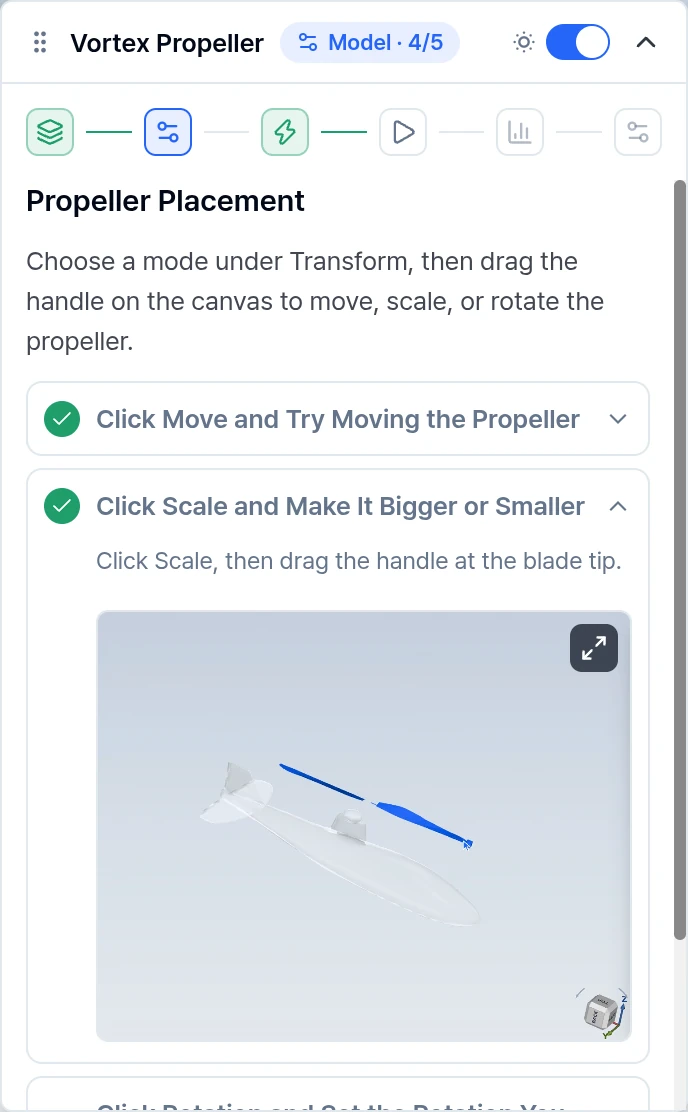
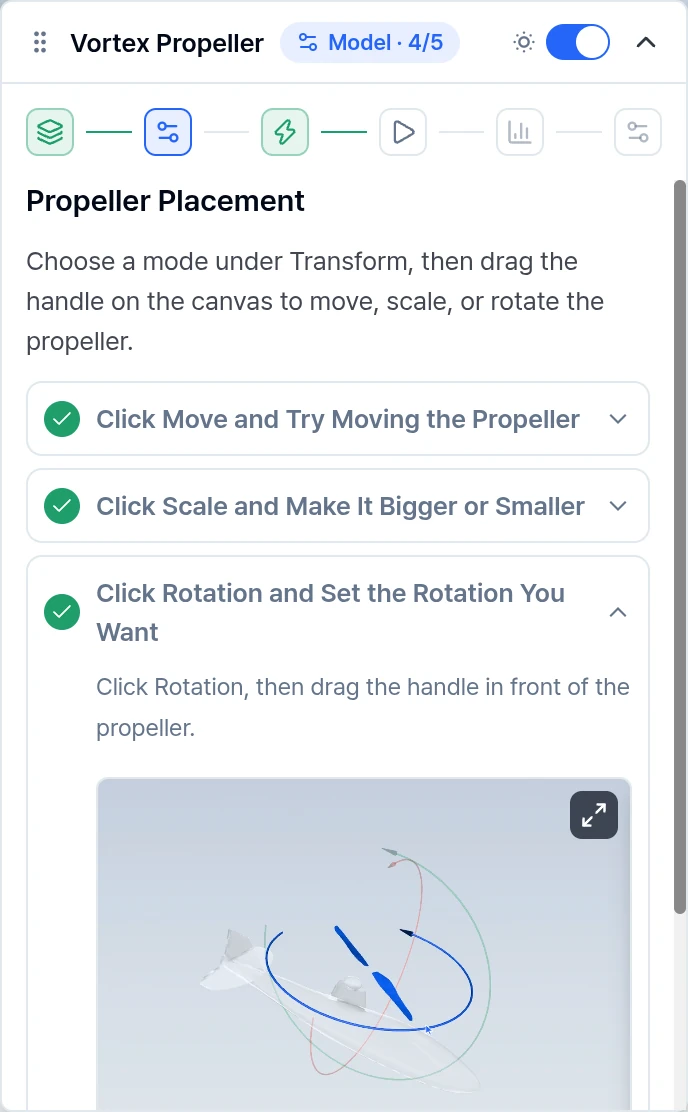
Choose a mode under Transform, then drag the handle on the canvas. Transform sits below Thrust Direction in the propeller's settings.
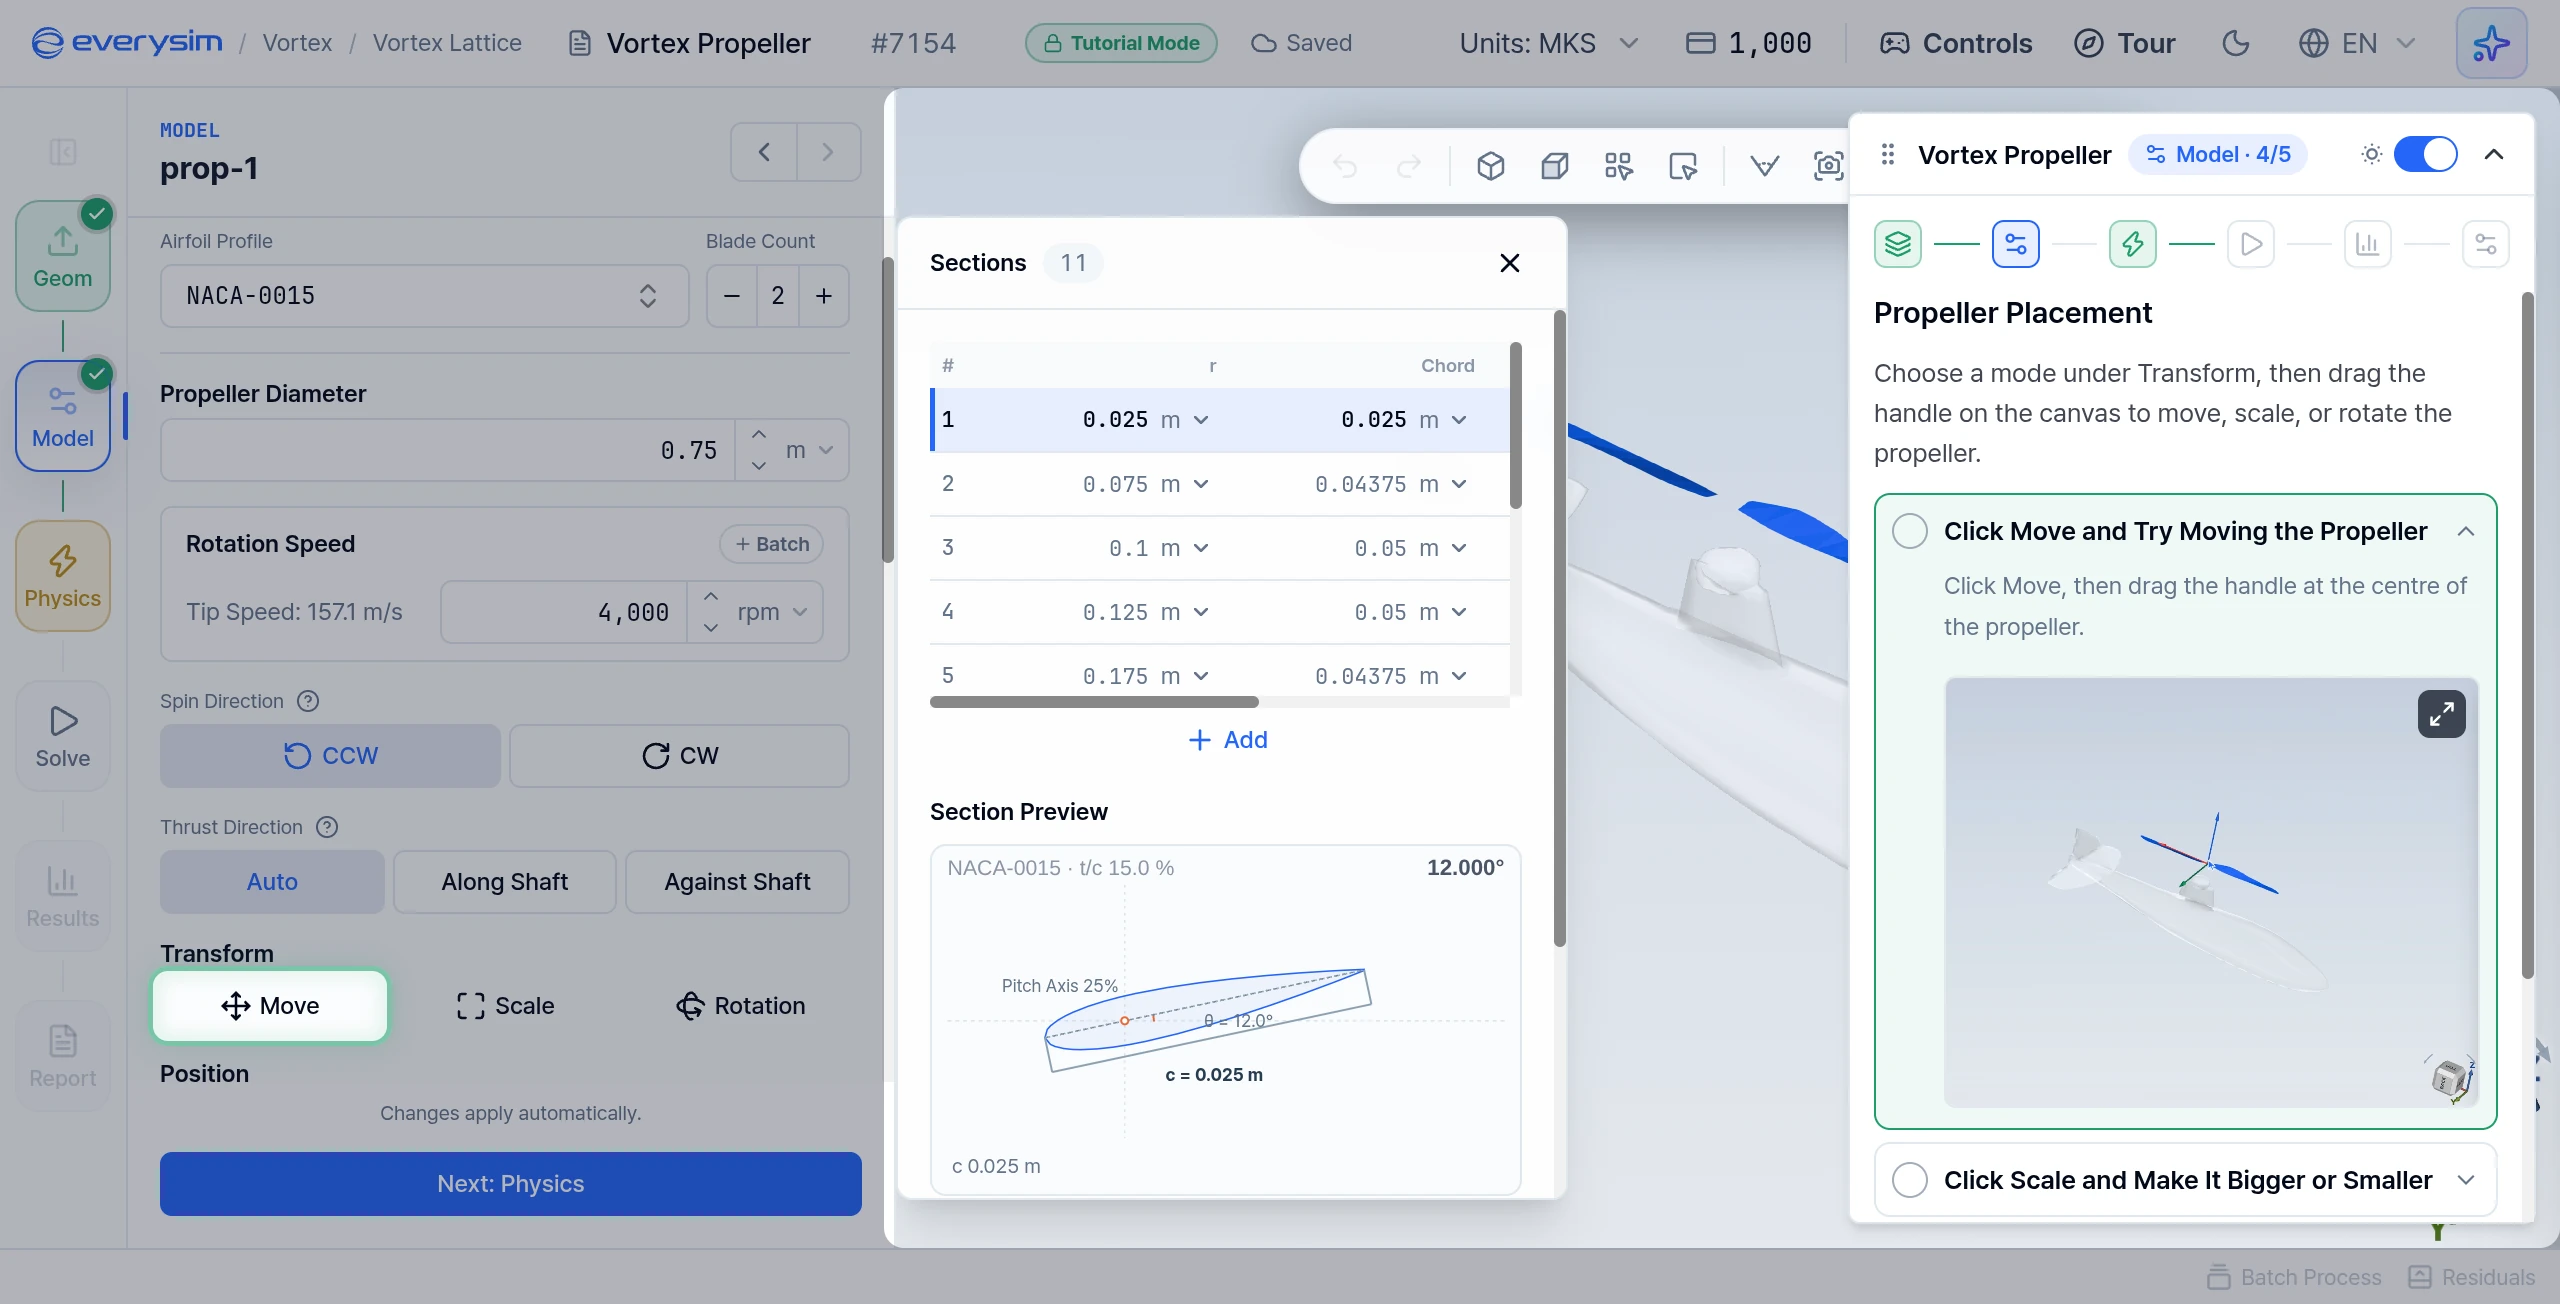
- Click Move and Try Moving the Propeller: click Move, then drag the handle at the centre of the propeller.
- Click Scale and Make It Bigger or Smaller: click Scale, then drag the handle at the blade tip.
- Click Rotation and Set the Rotation You Want: click Rotation, then drag the handle in front of the propeller.
Click Next.
Placement for the Simulation
This page has no task. The tutorial now sets the propeller placement for you so the simulation runs smoothly, so whatever you did with the handles does not affect the result. Propeller Diameter goes back to 0.75 m.
Click Next.
3. Physics
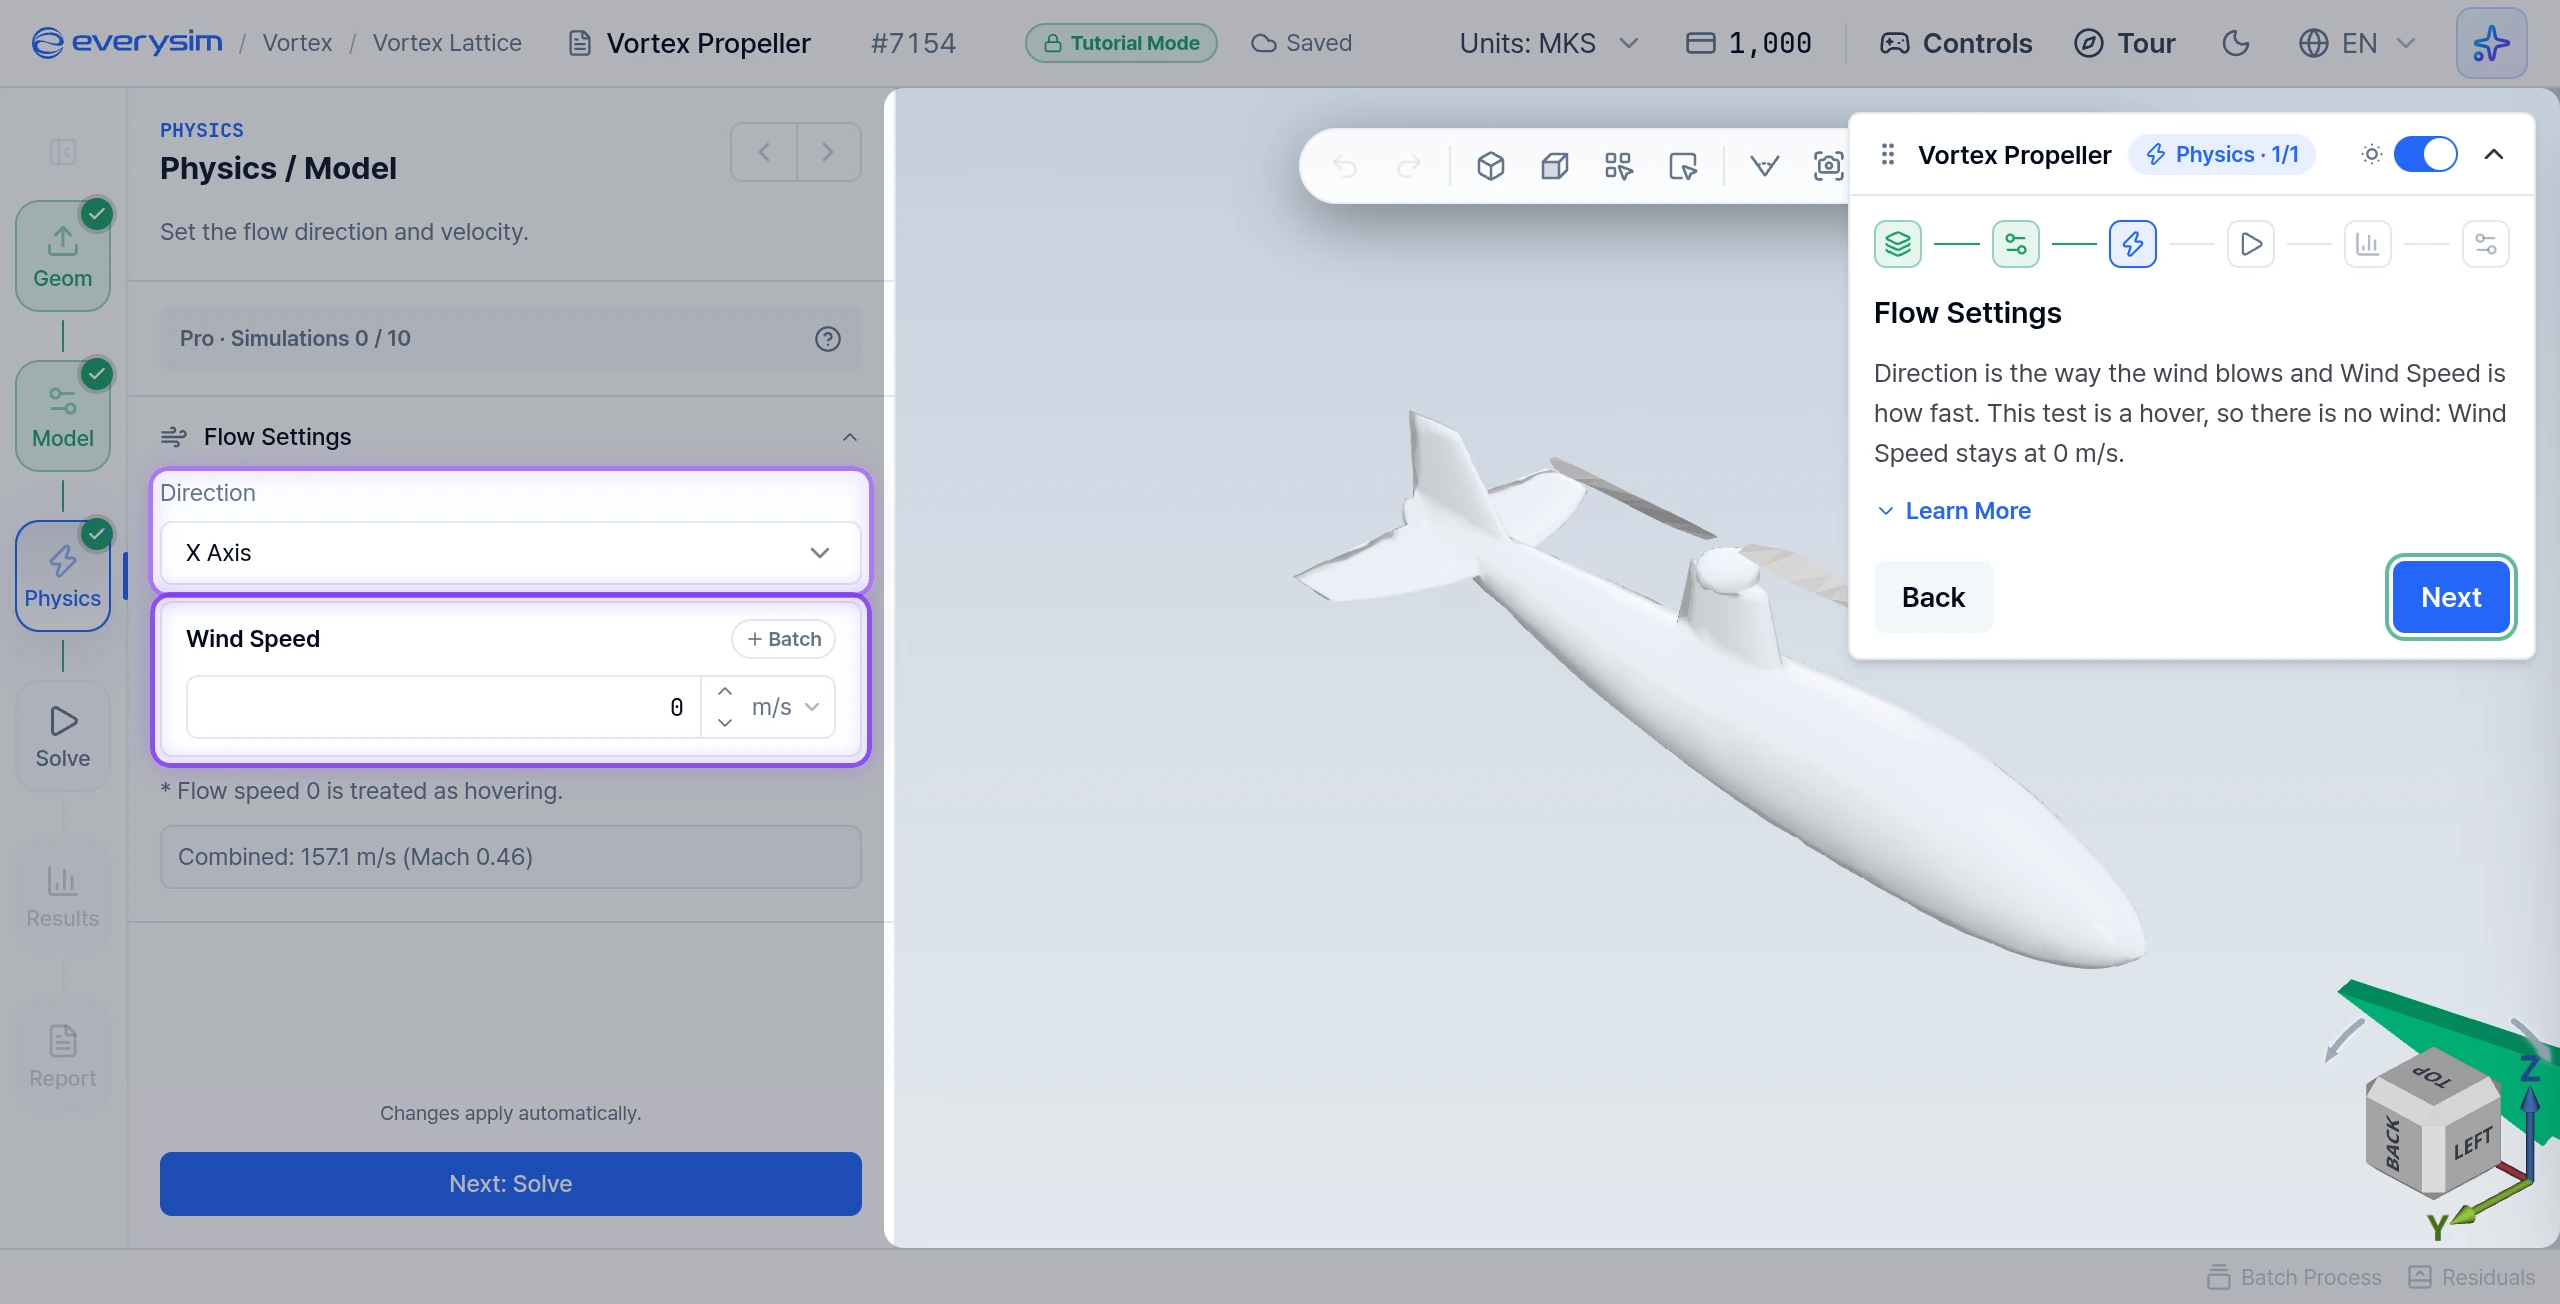
Flow Settings
This page has no task. Direction is the way the wind blows and Wind Speed is how fast. This test is a hover, so there is no wind and Wind Speed stays at 0 m/s.
In a hover the only air that moves is what the rotor pushes down itself. With no wind, the direction makes no difference.
Click Next.
4. Solve
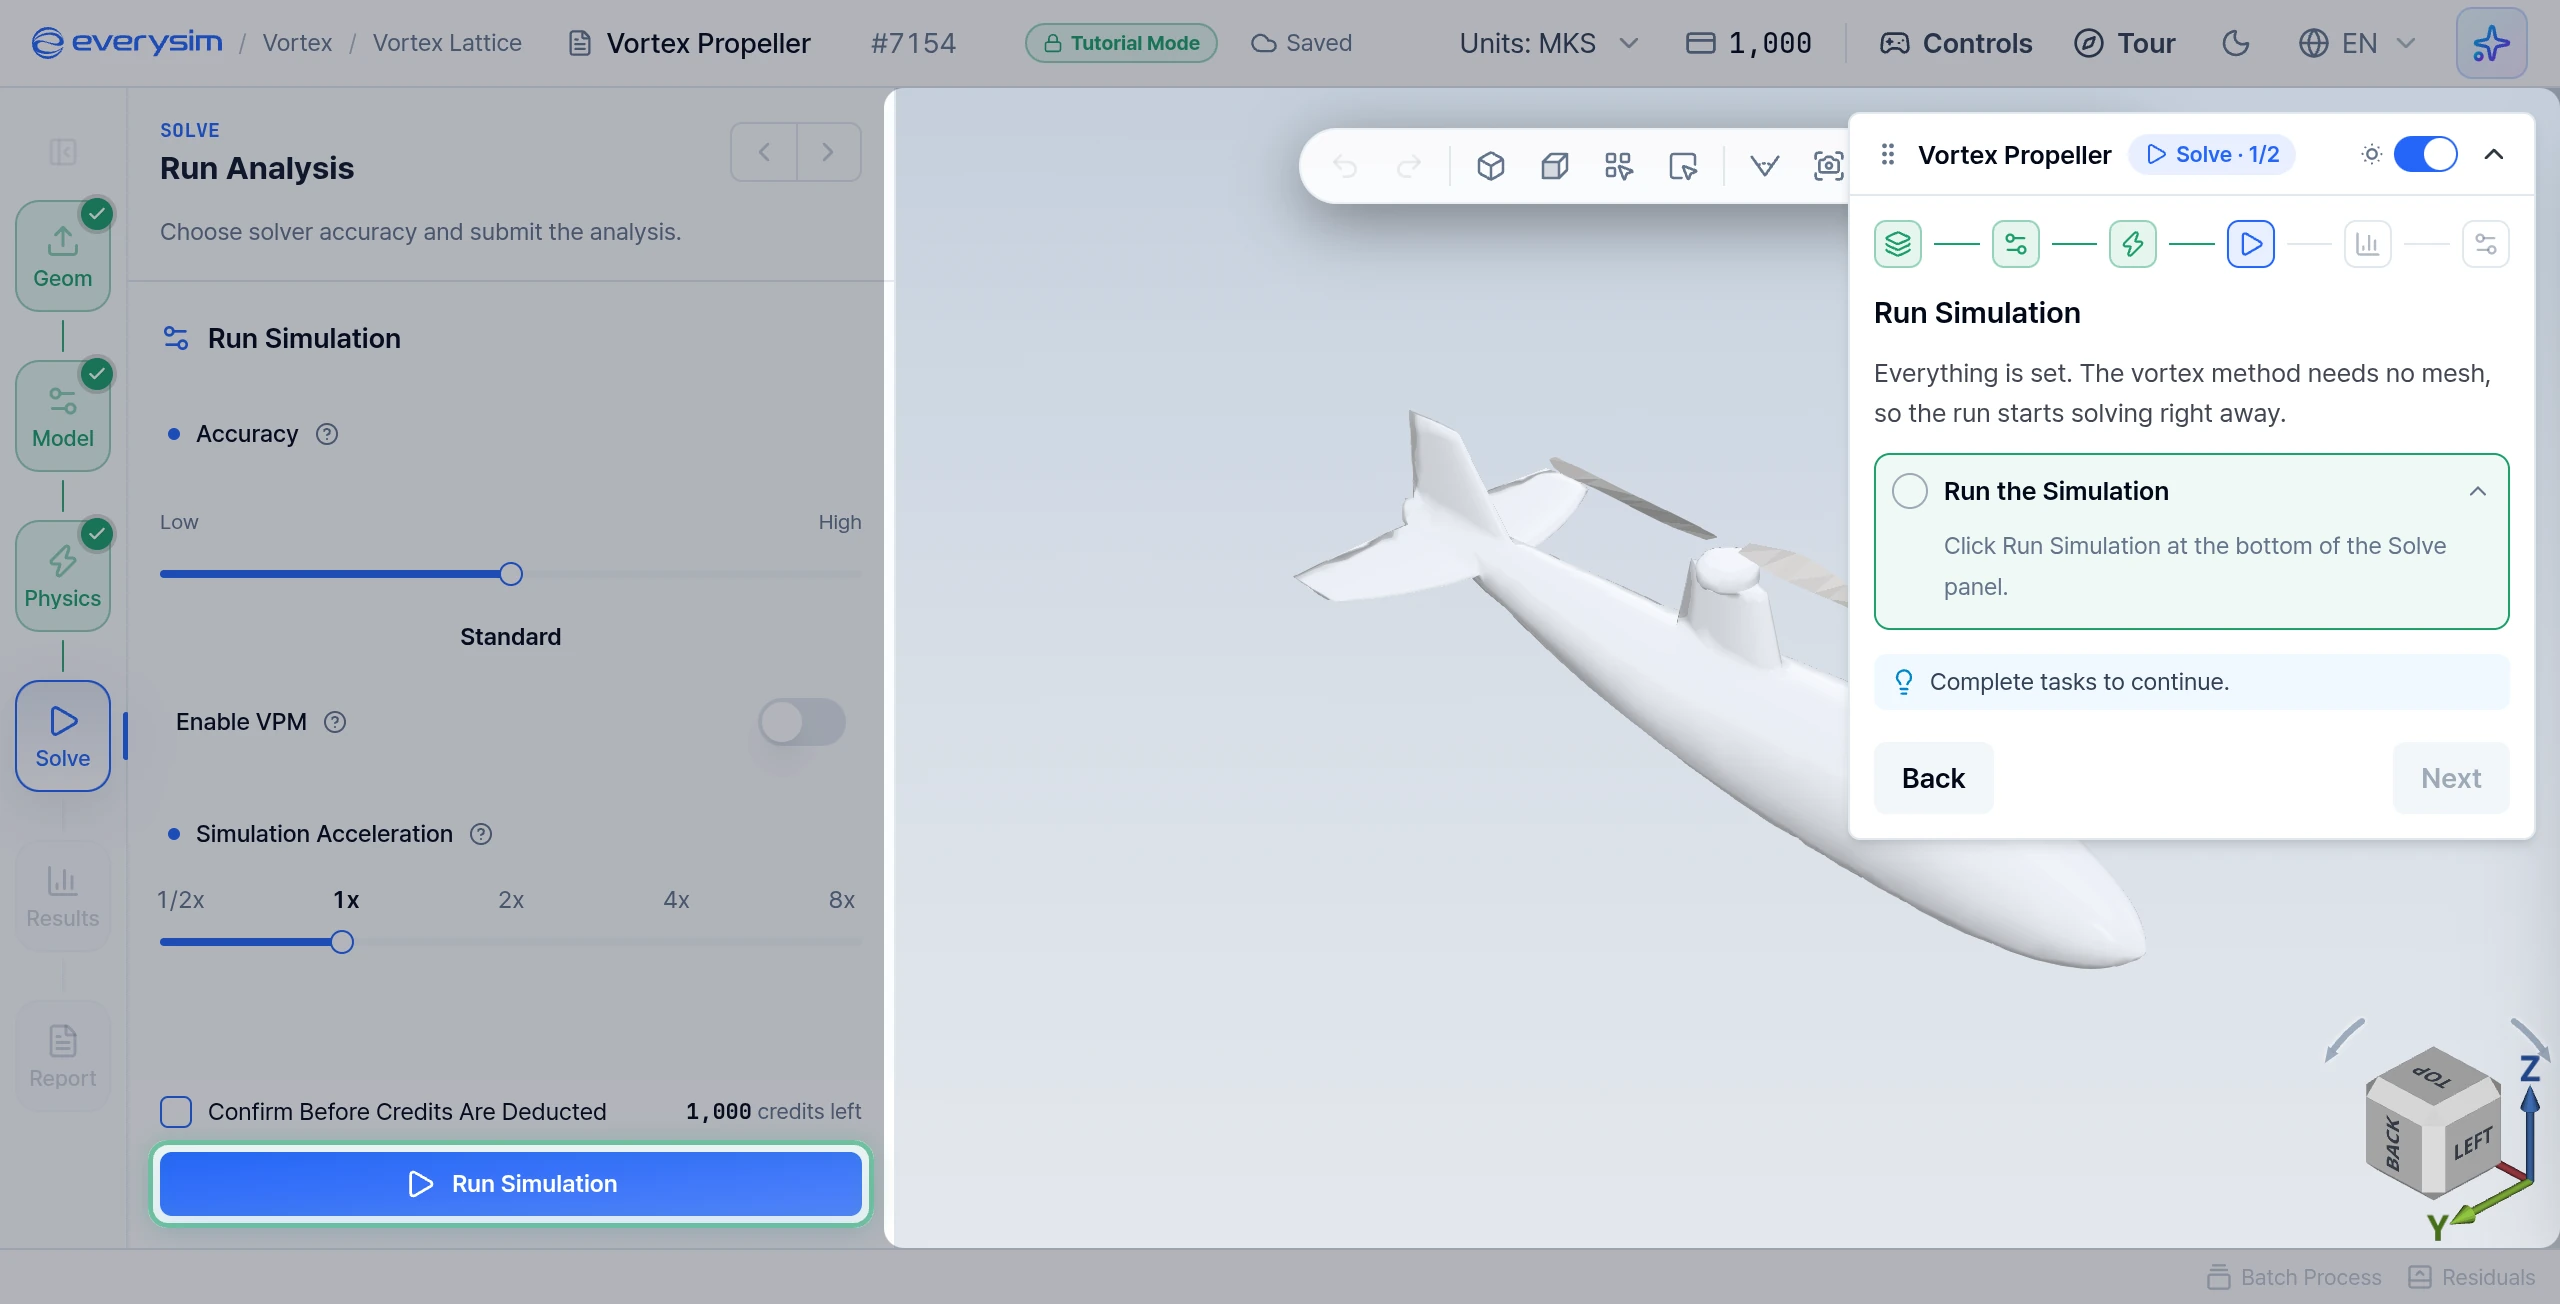
Run Simulation
Everything is set. Rapid Aerodynamics needs no mesh, so the run starts solving right away.
- Run the Simulation: click Run Simulation at the bottom of the Solve panel.
The guide moves to the next page by itself.
Simulation Progress
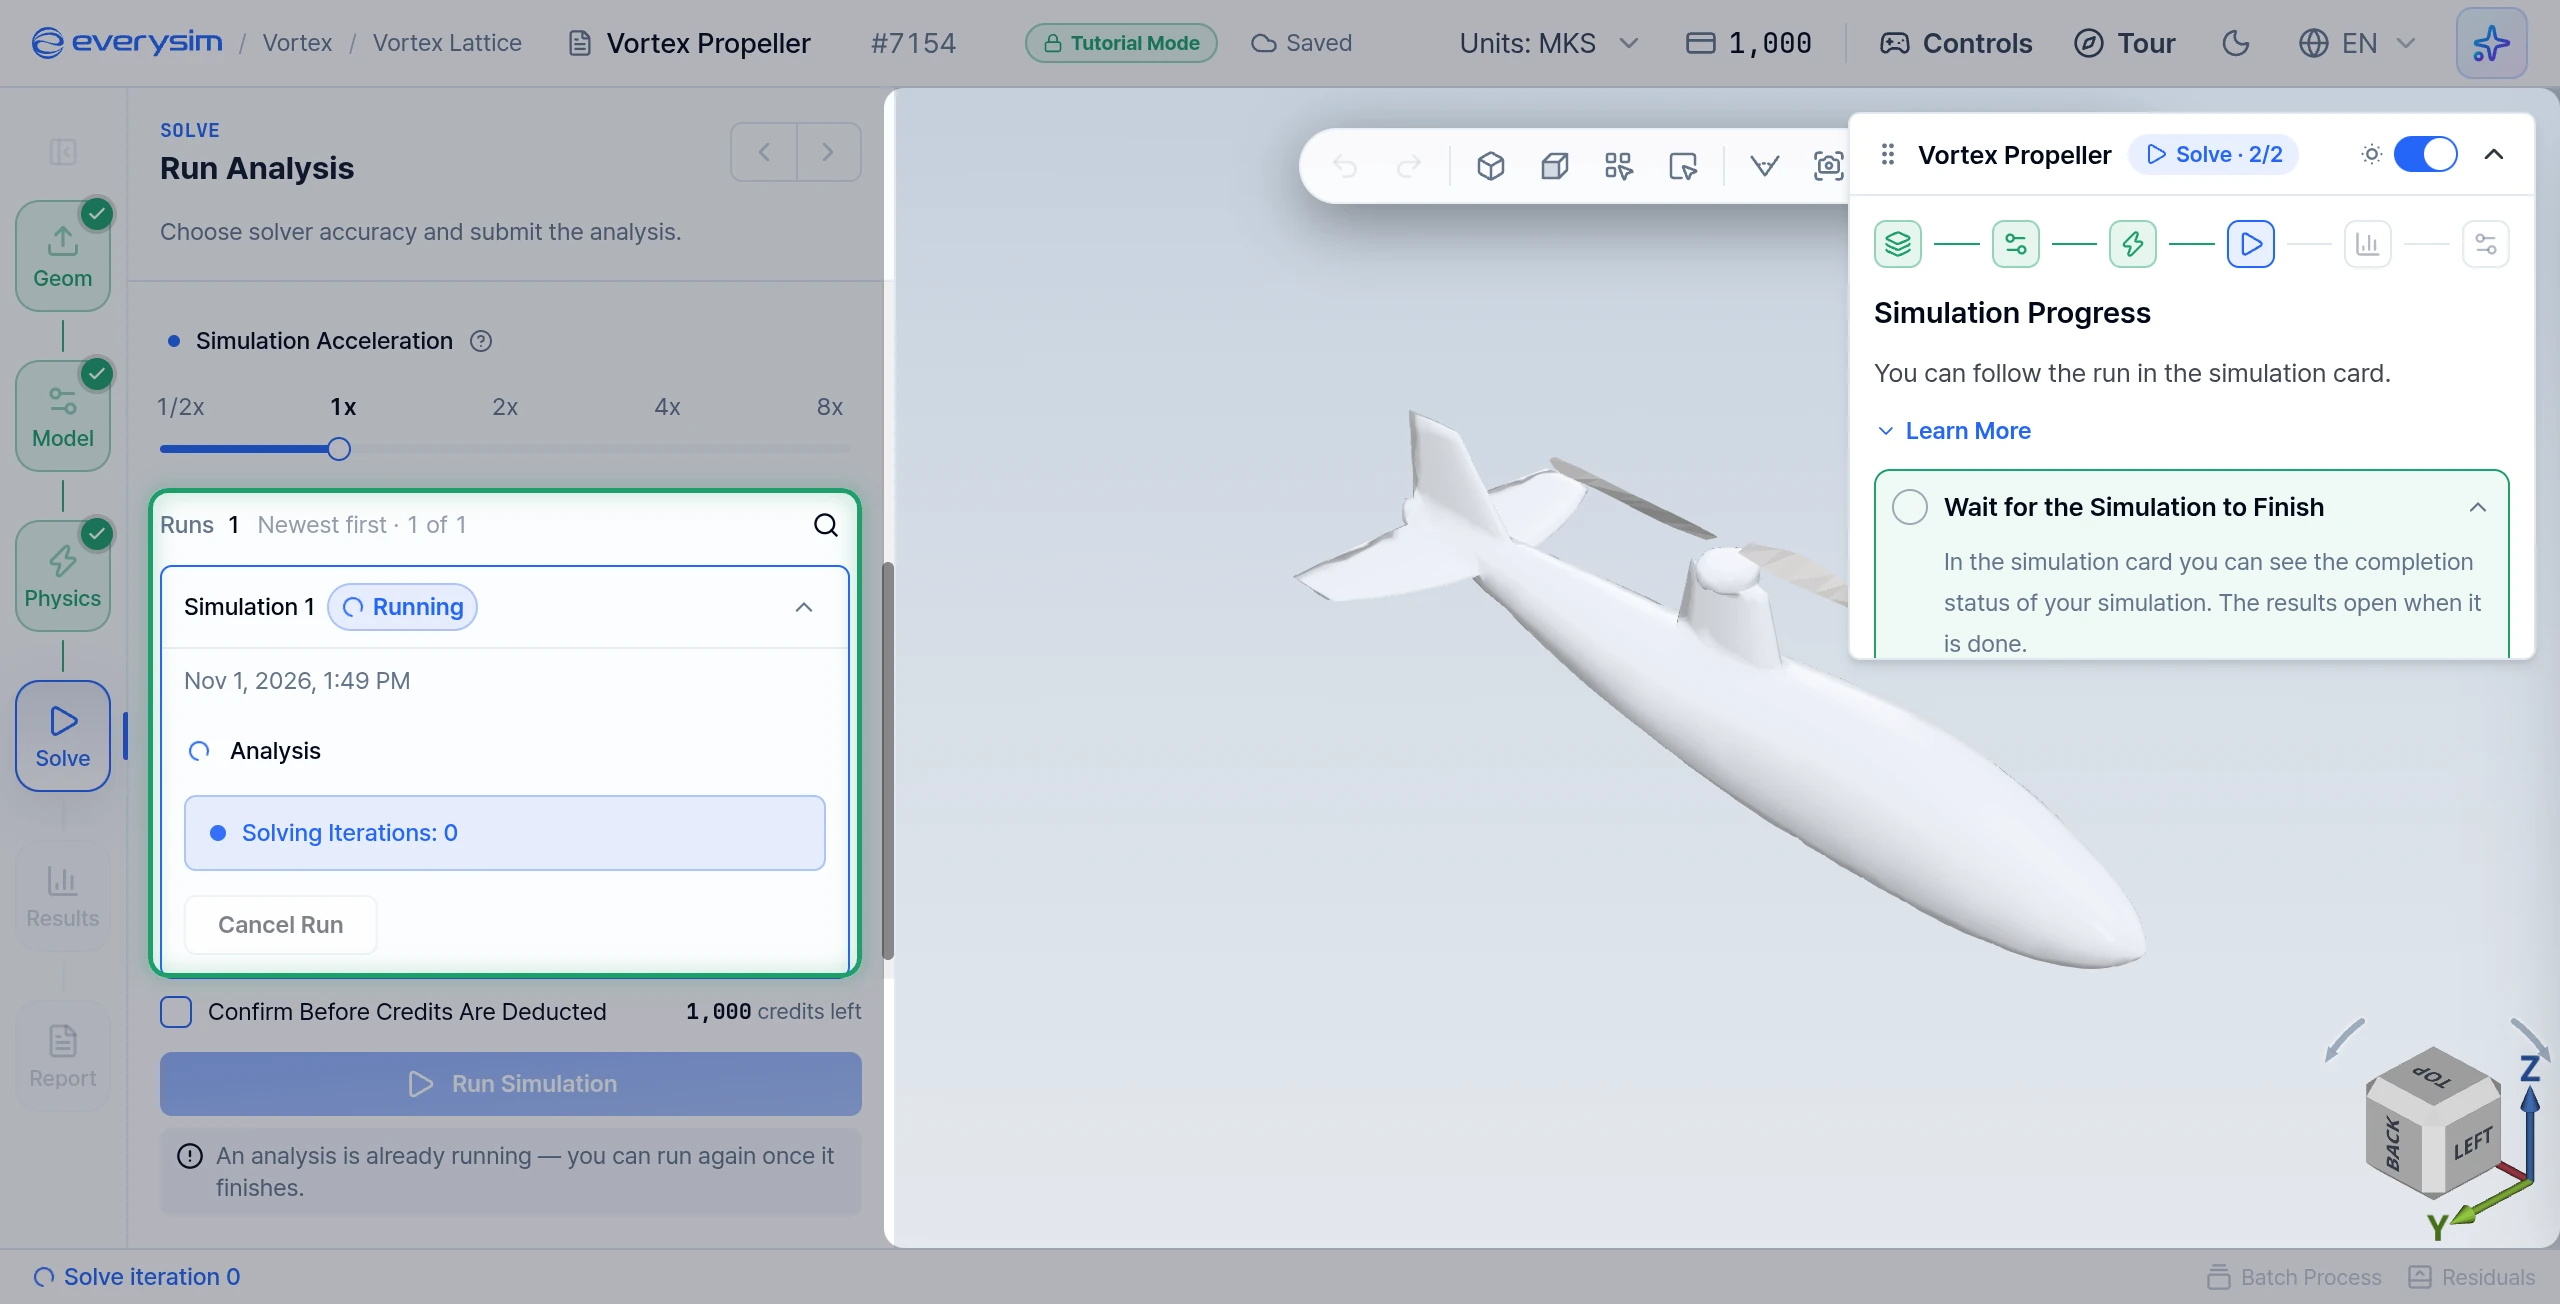
Follow the run in the simulation card. A Rapid Aerodynamics run has a single step, Analysis, and the card counts the solver steps as Solving Iterations. With every step the propeller turns a little further and the wake grows, so the result builds up over time.
- Wait for the Simulation to Finish: the results open when it is done, about 3 seconds after you click Run Simulation.
5. Results
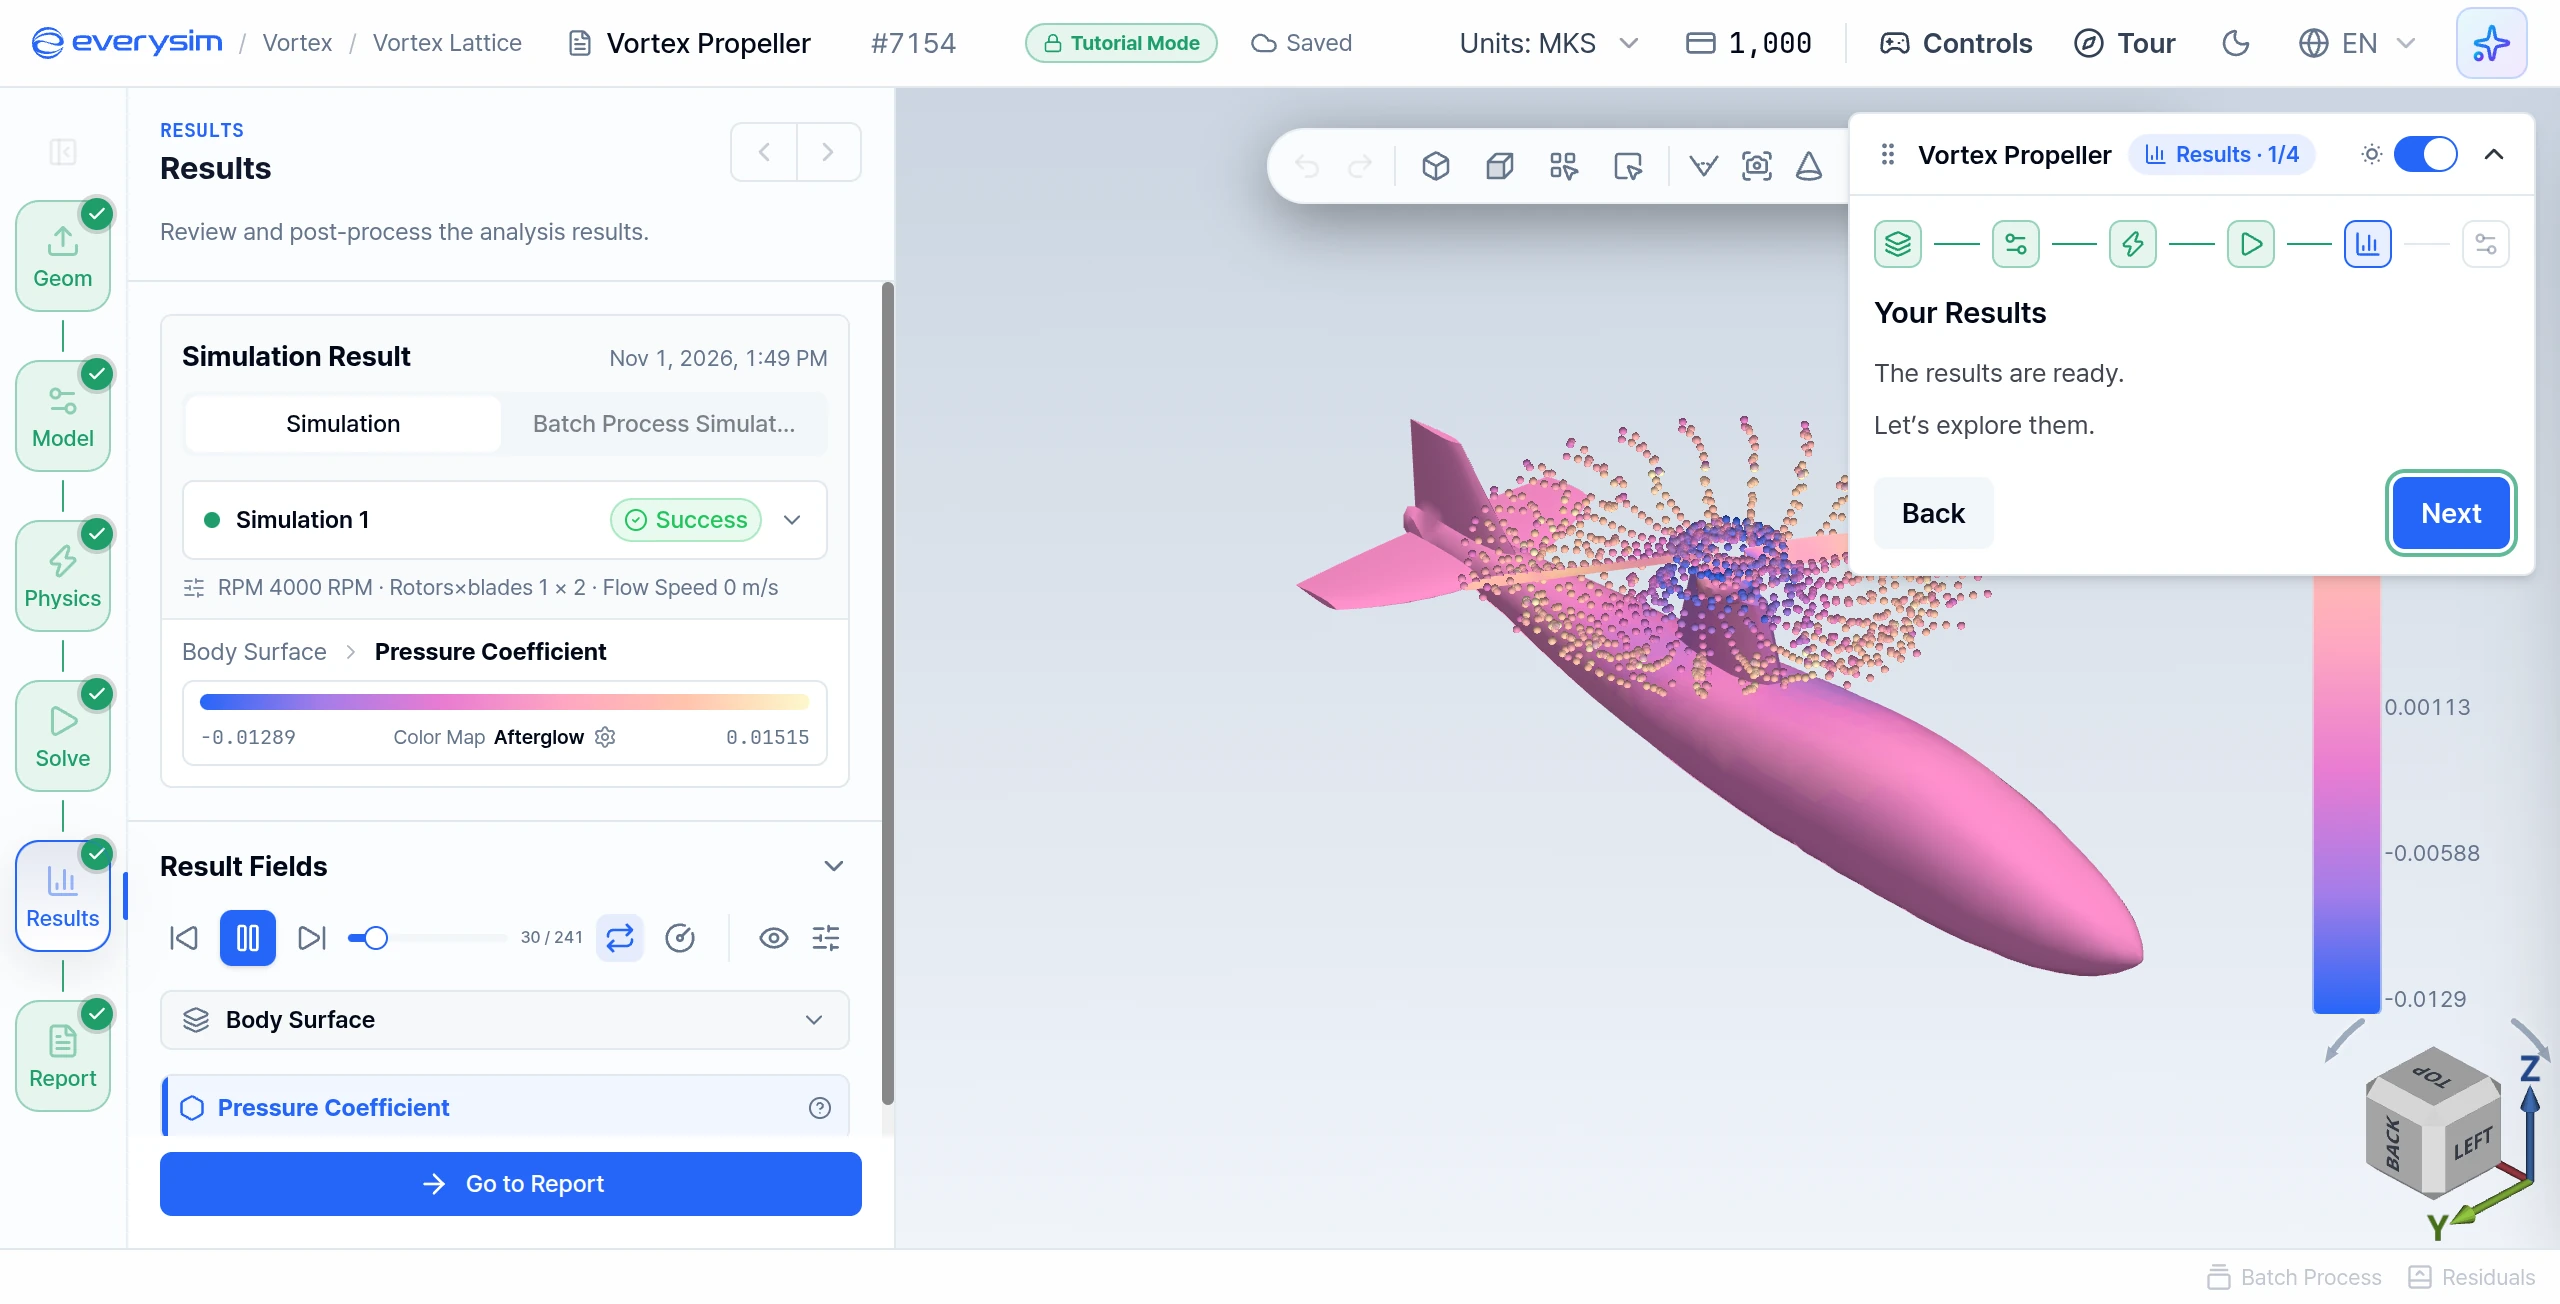
Your Results
This page has no task. The results are ready. Click Next to explore them.
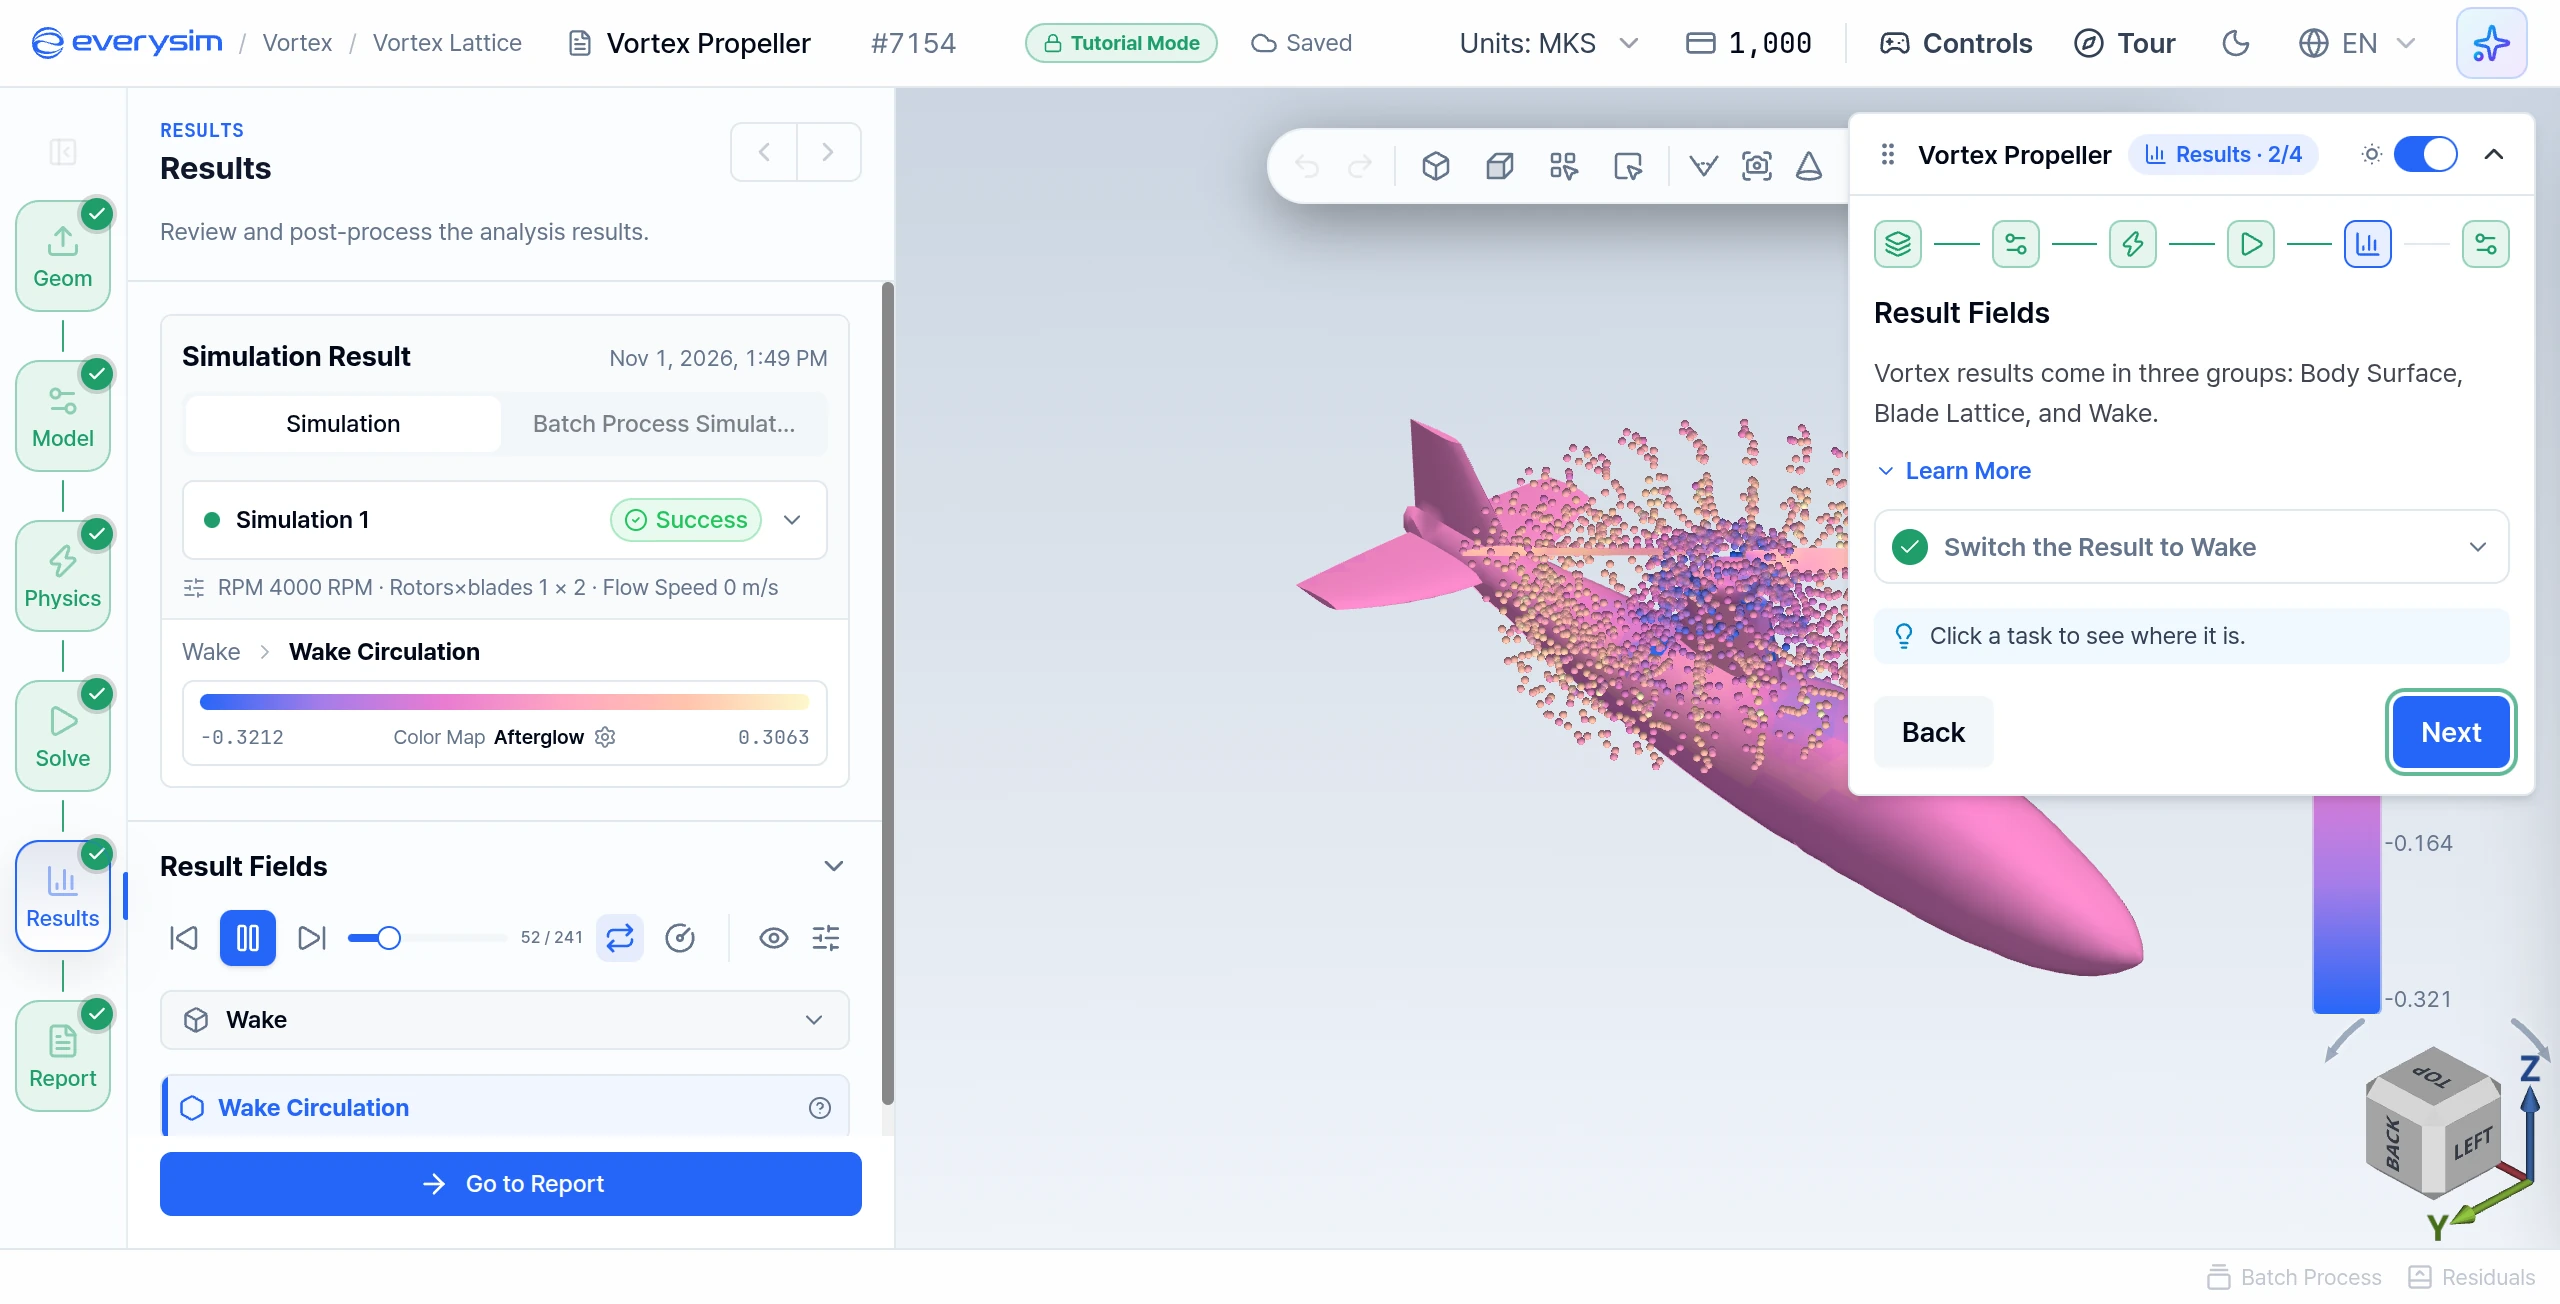
Result Fields
Rapid Aerodynamics results come in three groups:
| Group | Shows | Field |
|---|---|---|
| Body Surface | The pressure on your geometry | Pressure Coefficient |
| Blade Lattice | The loading on the propeller blades | Blade Circulation, Blade Pressure Coefficient |
| Wake | The swirling air the propeller leaves behind | Wake Circulation |
- Switch the Result to Wake: select Wake in the result selector. It shows how strong the swirl is along the wake, and how the wake washes over the geometry.
Click Next.
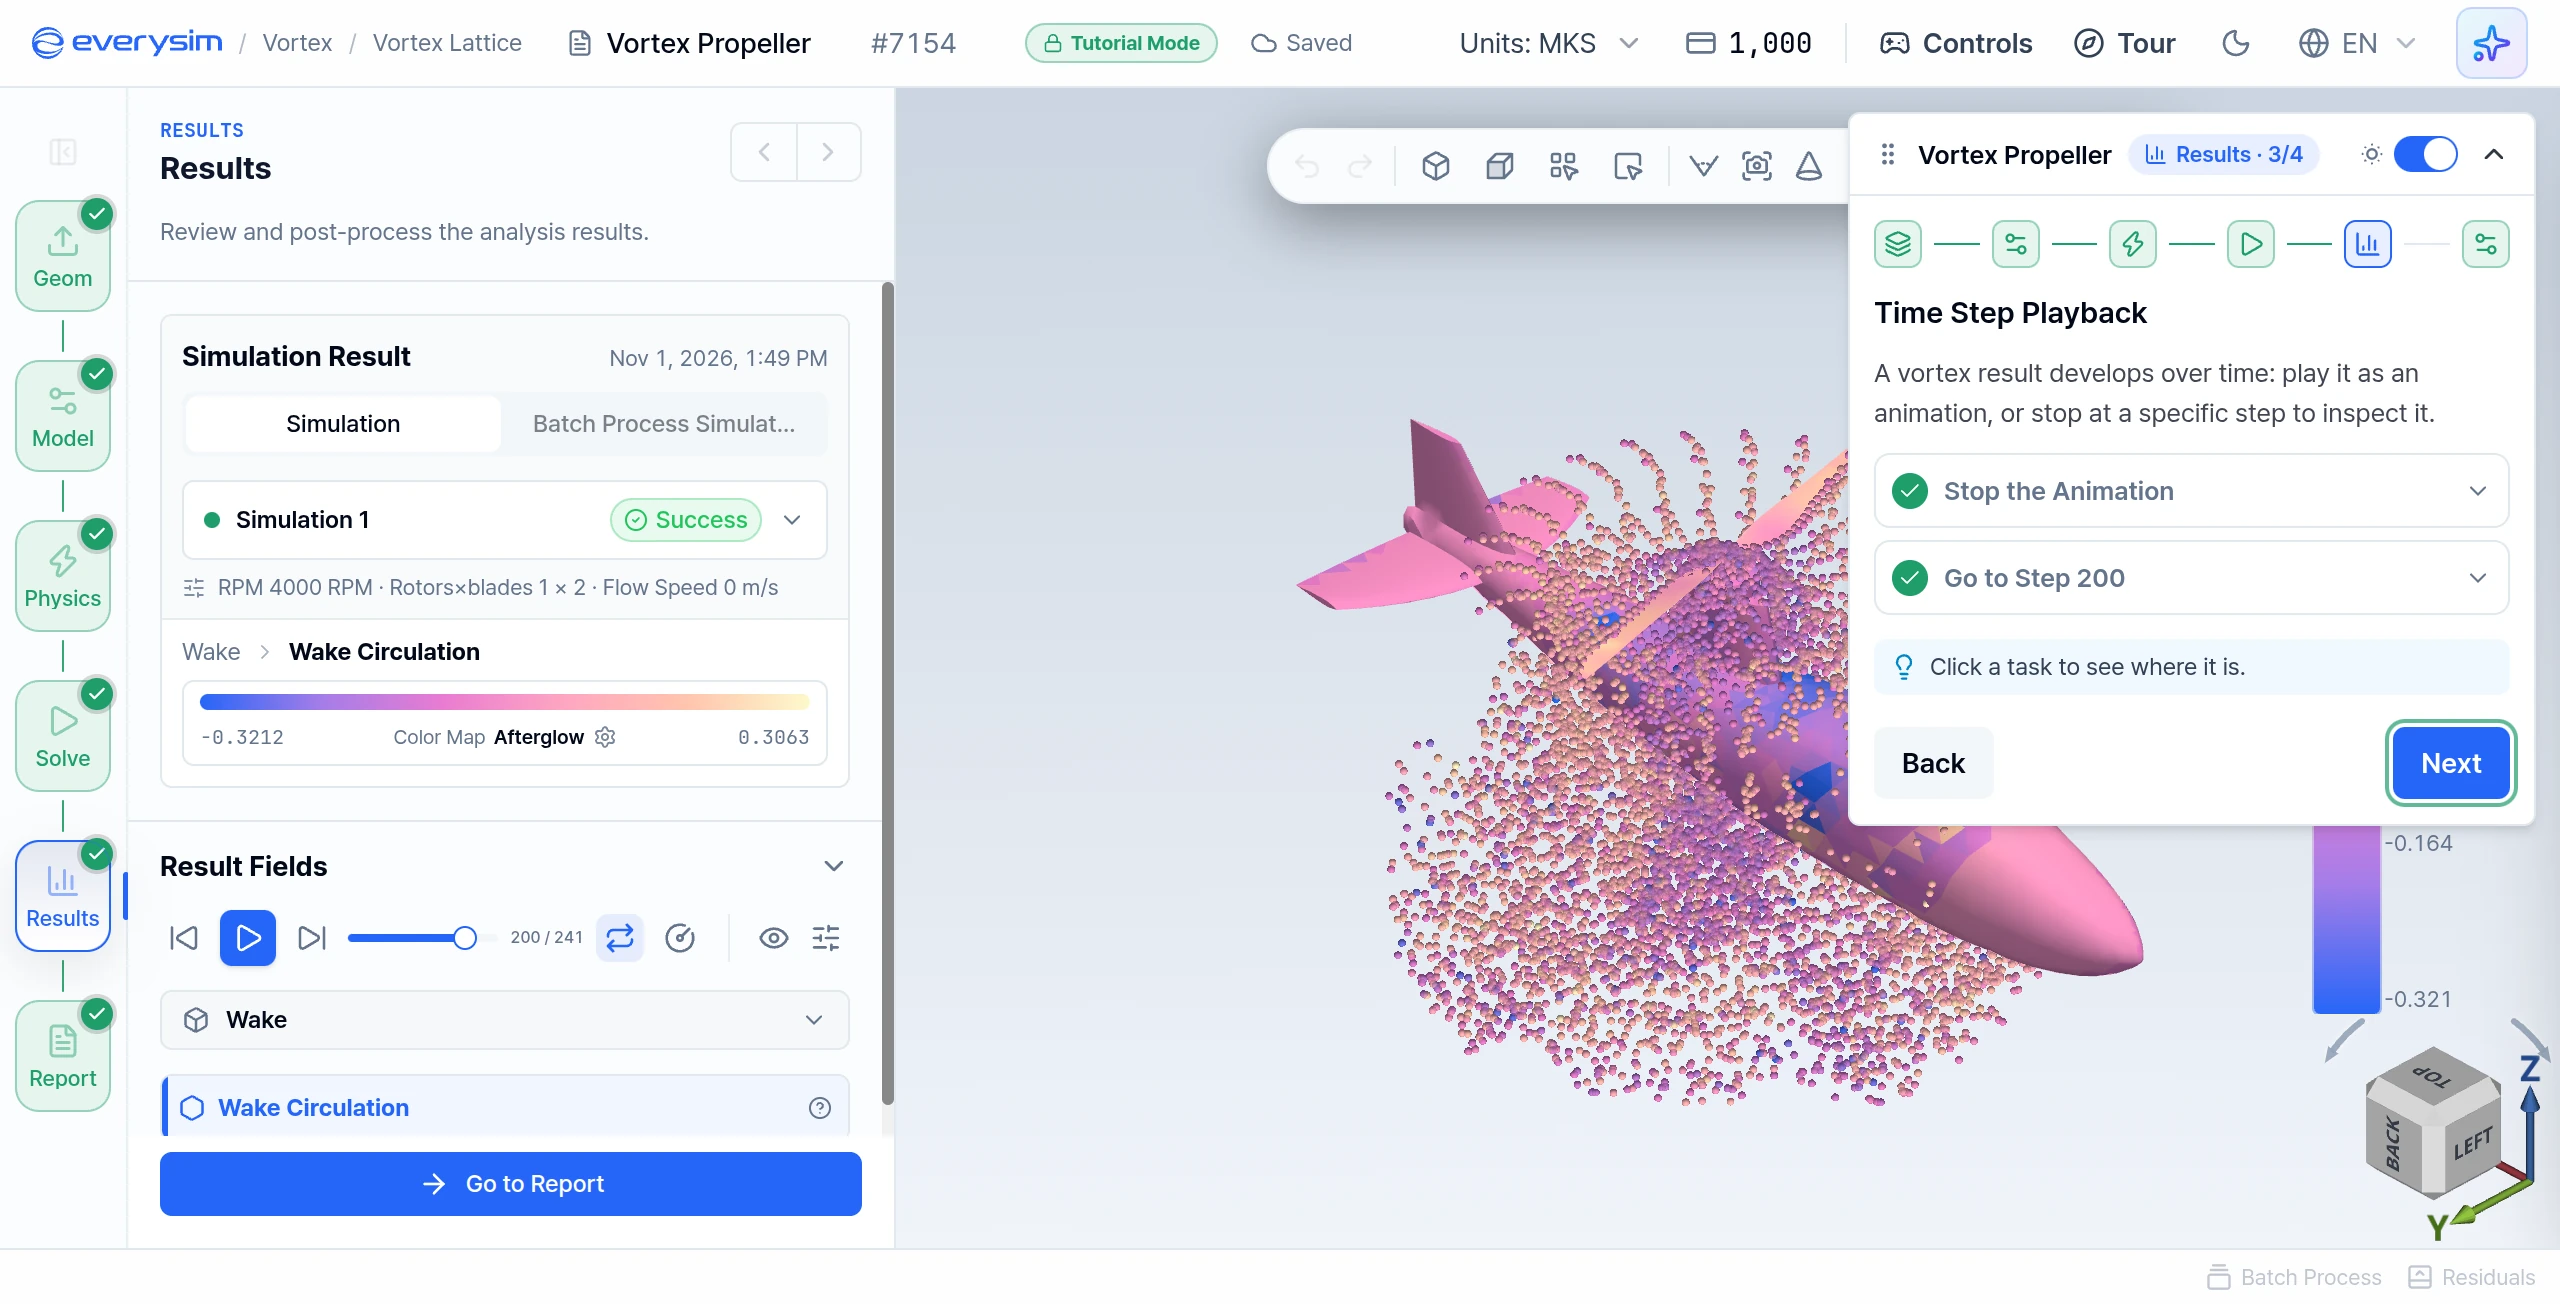
Time Step Playback
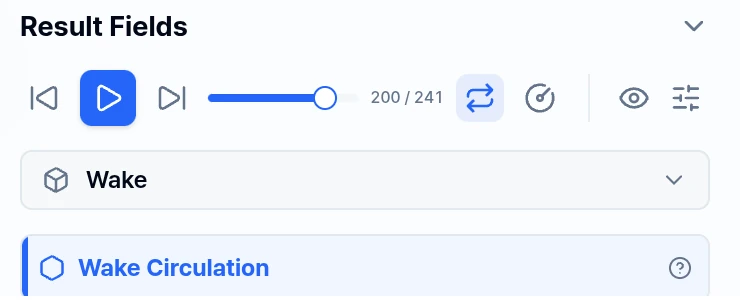
A Rapid Aerodynamics result develops over time. Play it as an animation, or stop at a specific step to inspect it. The controls are in Result Fields in the left Results panel.
- Stop the Animation: press Pause. If it is not playing, press Play first.
- Go to Step 200: drag the slider to step 200. The Previous Frame and Next Frame buttons move one step at a time, so you can land on it exactly. The counter then reads
200 / 241.
Click Next.
Report
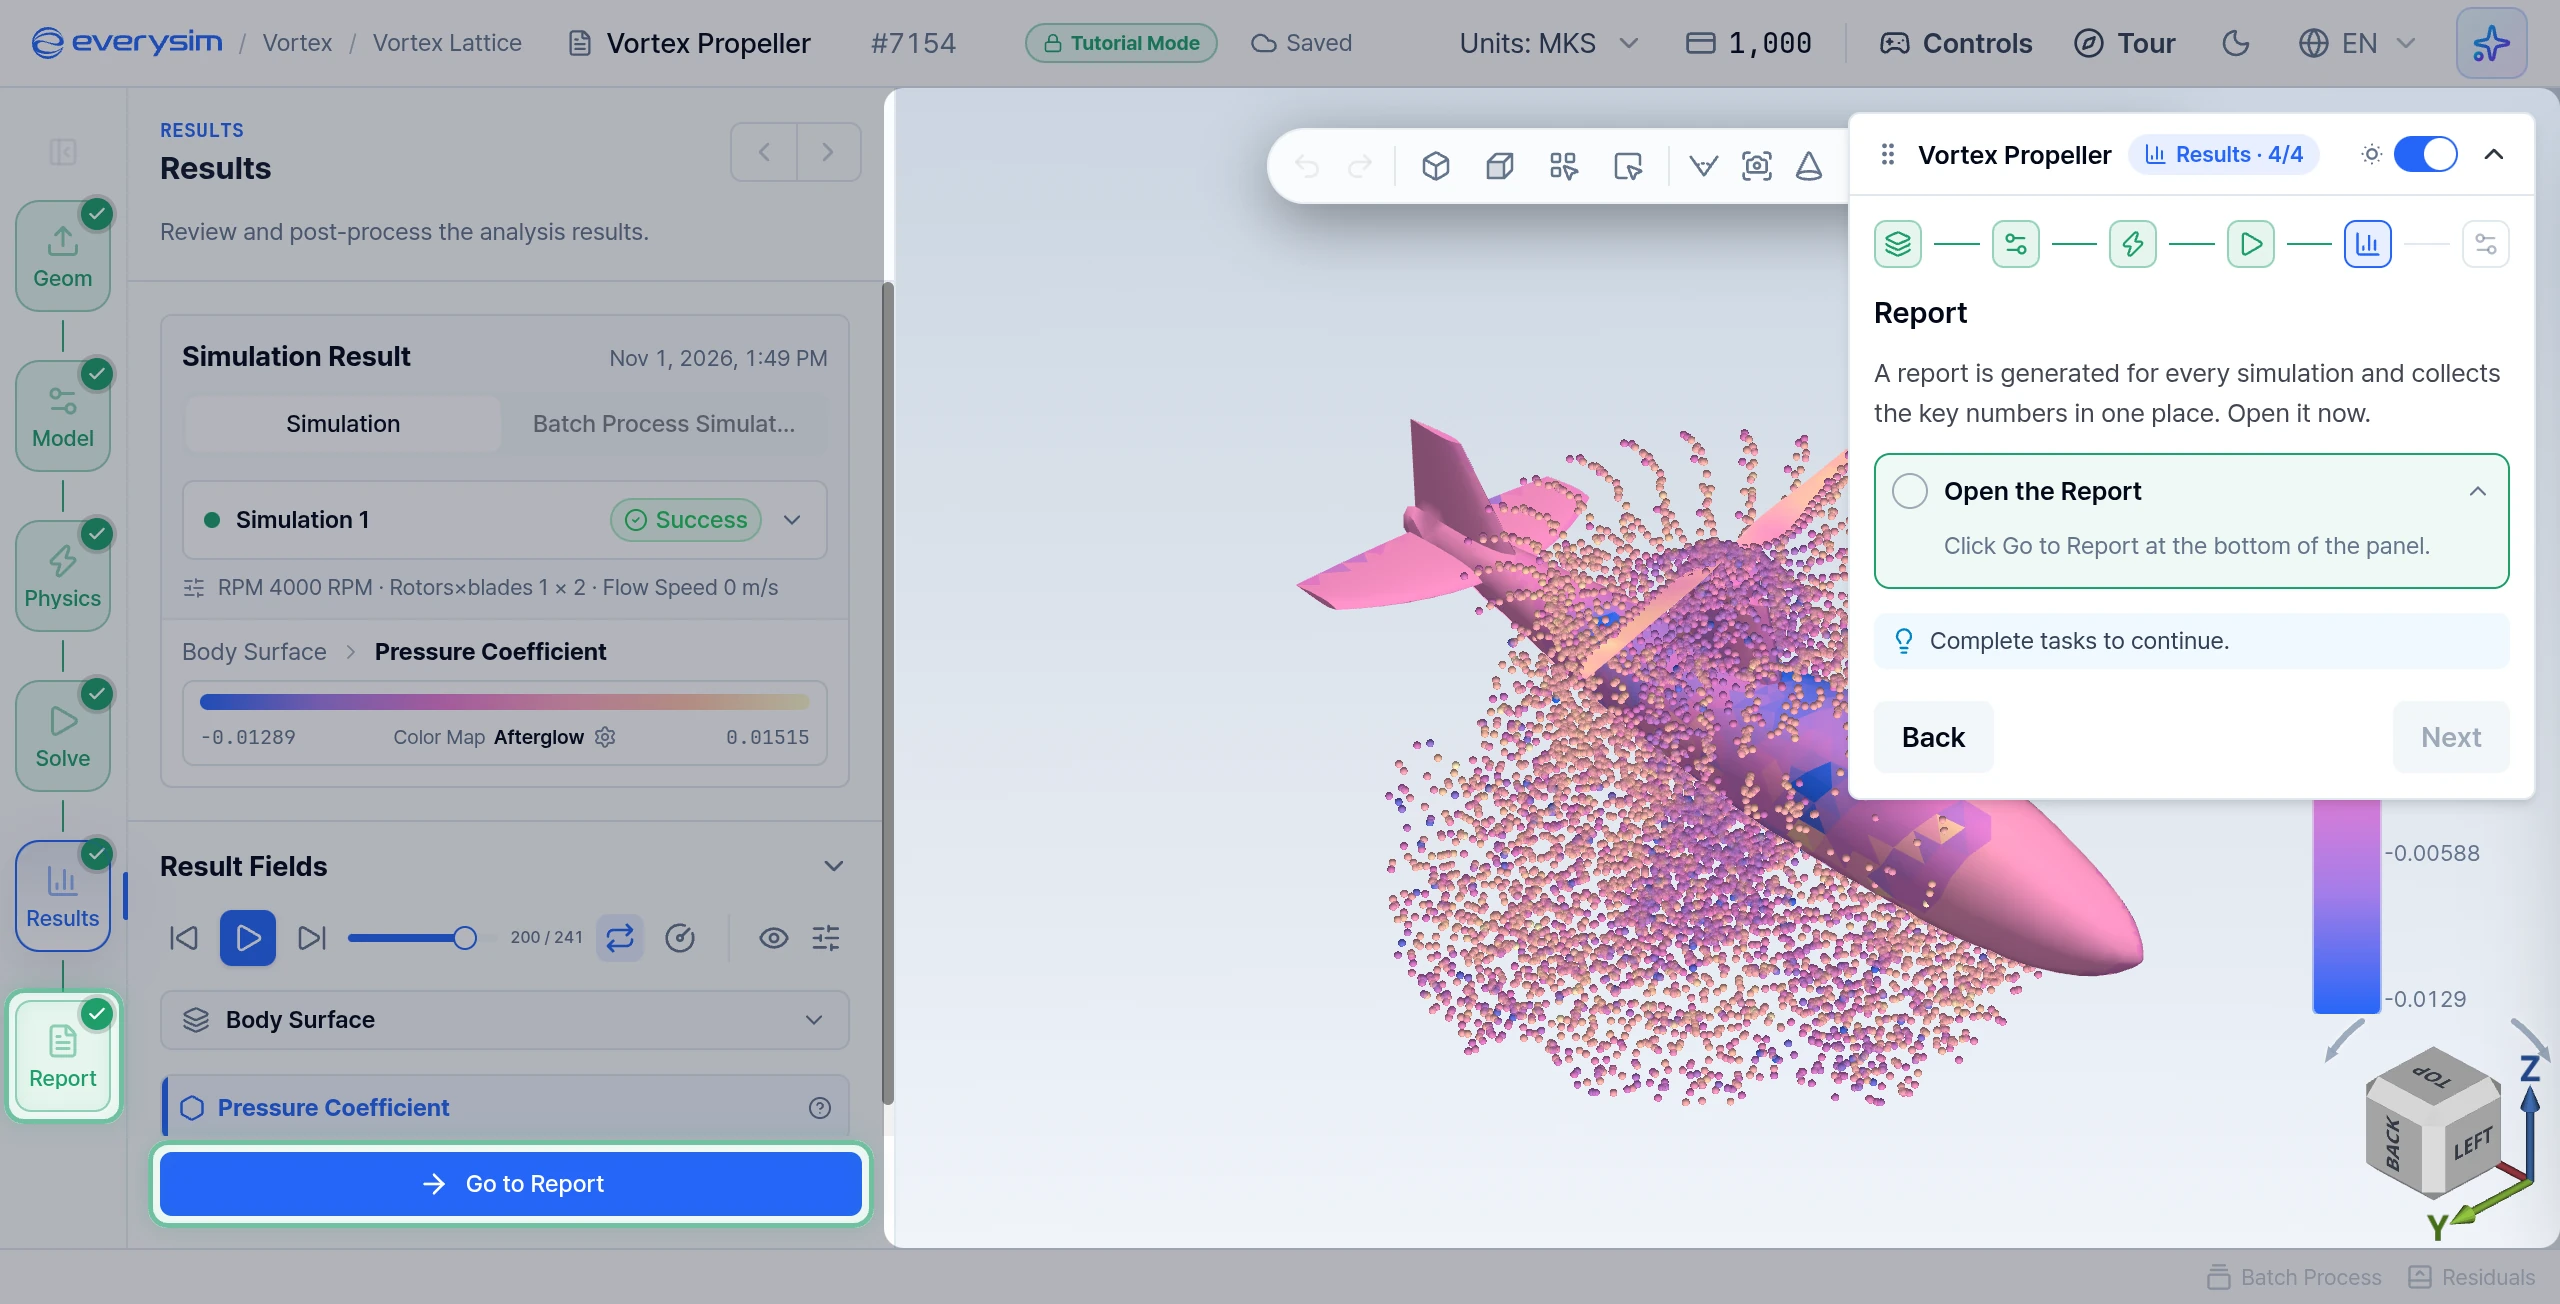
A report is generated for every simulation and collects the key numbers in one place.
- Open the Report: click Go to Report at the bottom of the panel.
The guide moves to the next page by itself.
6. Report
The guide scrolls the report to each section. None of these pages has a task until the last one.
Forces and Moments
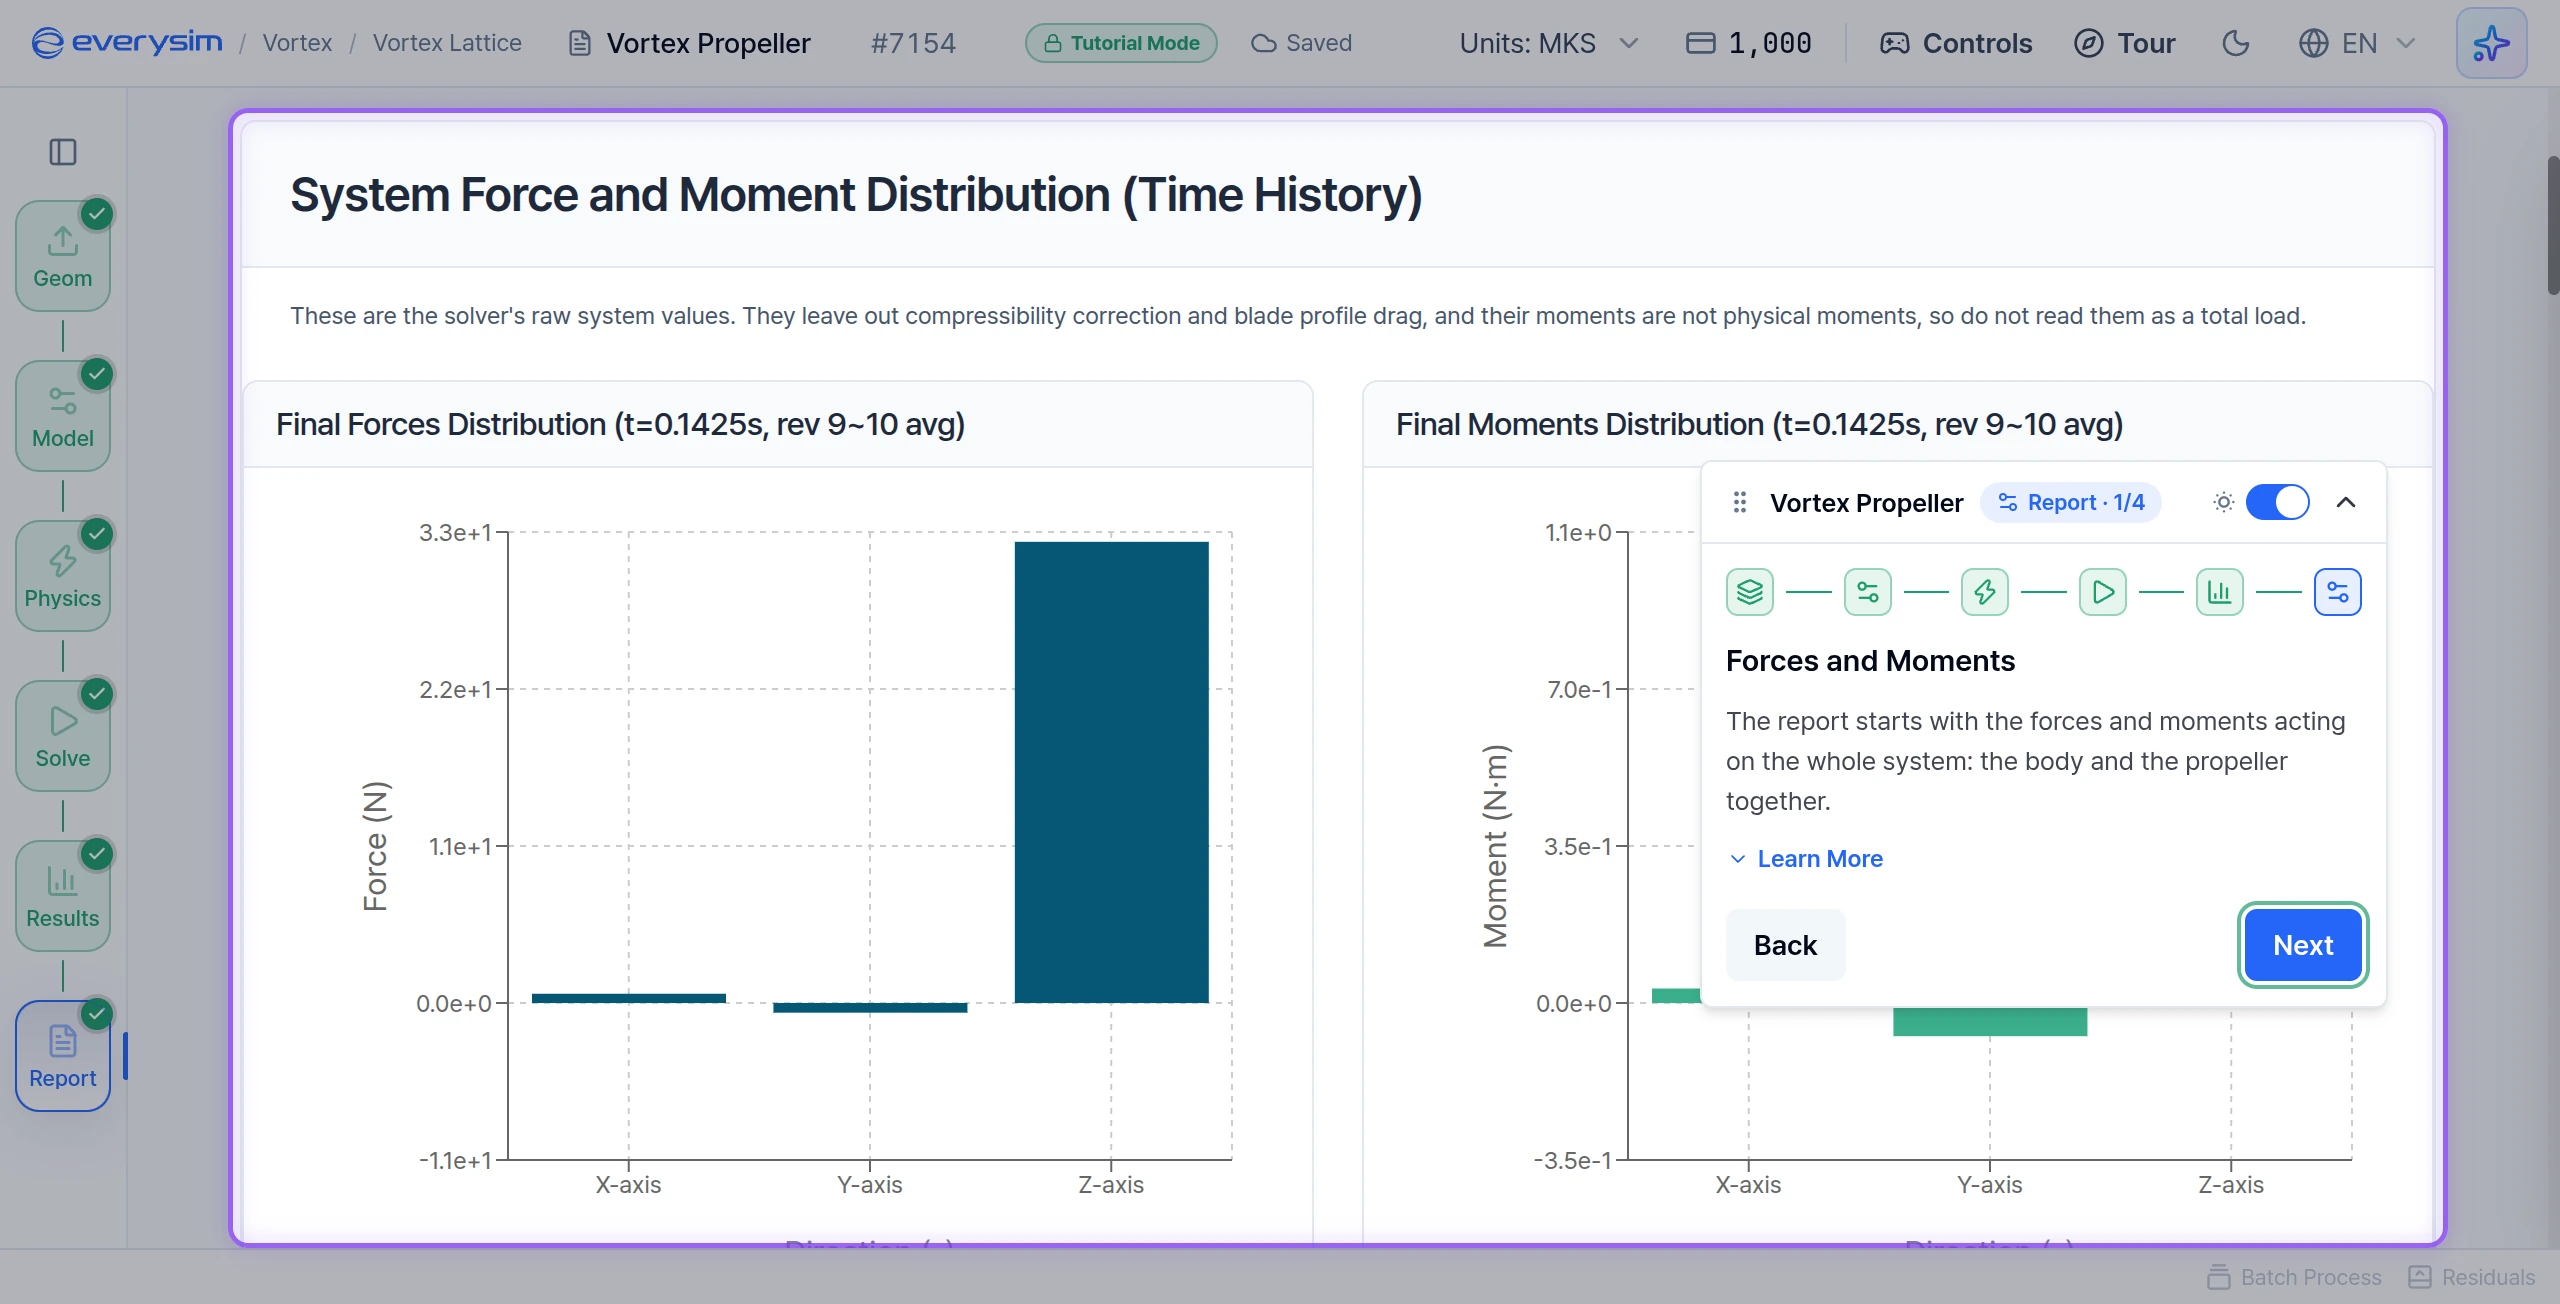
The report starts with the forces and moments acting on the whole system: the body and the propeller together. The bars show the final values in each direction. The line chart shows how they changed during the run and then settled.
Almost all of the force is along Z and upward: the rotor lifting the system. X and Y stay close to zero, as they should in a hover.
These are the solver's raw system values. They leave out compressibility correction and blade profile drag, and their moments are not physical moments, so do not read them as a total load.
A note at the top of the report says the same for this result: its thrust, shaft torque and shaft power are sound, while its in-plane force, moment vectors and rotor-plus-body total are not available. Use the values in the next two sections.
Click Next.
Core Performance Metrics
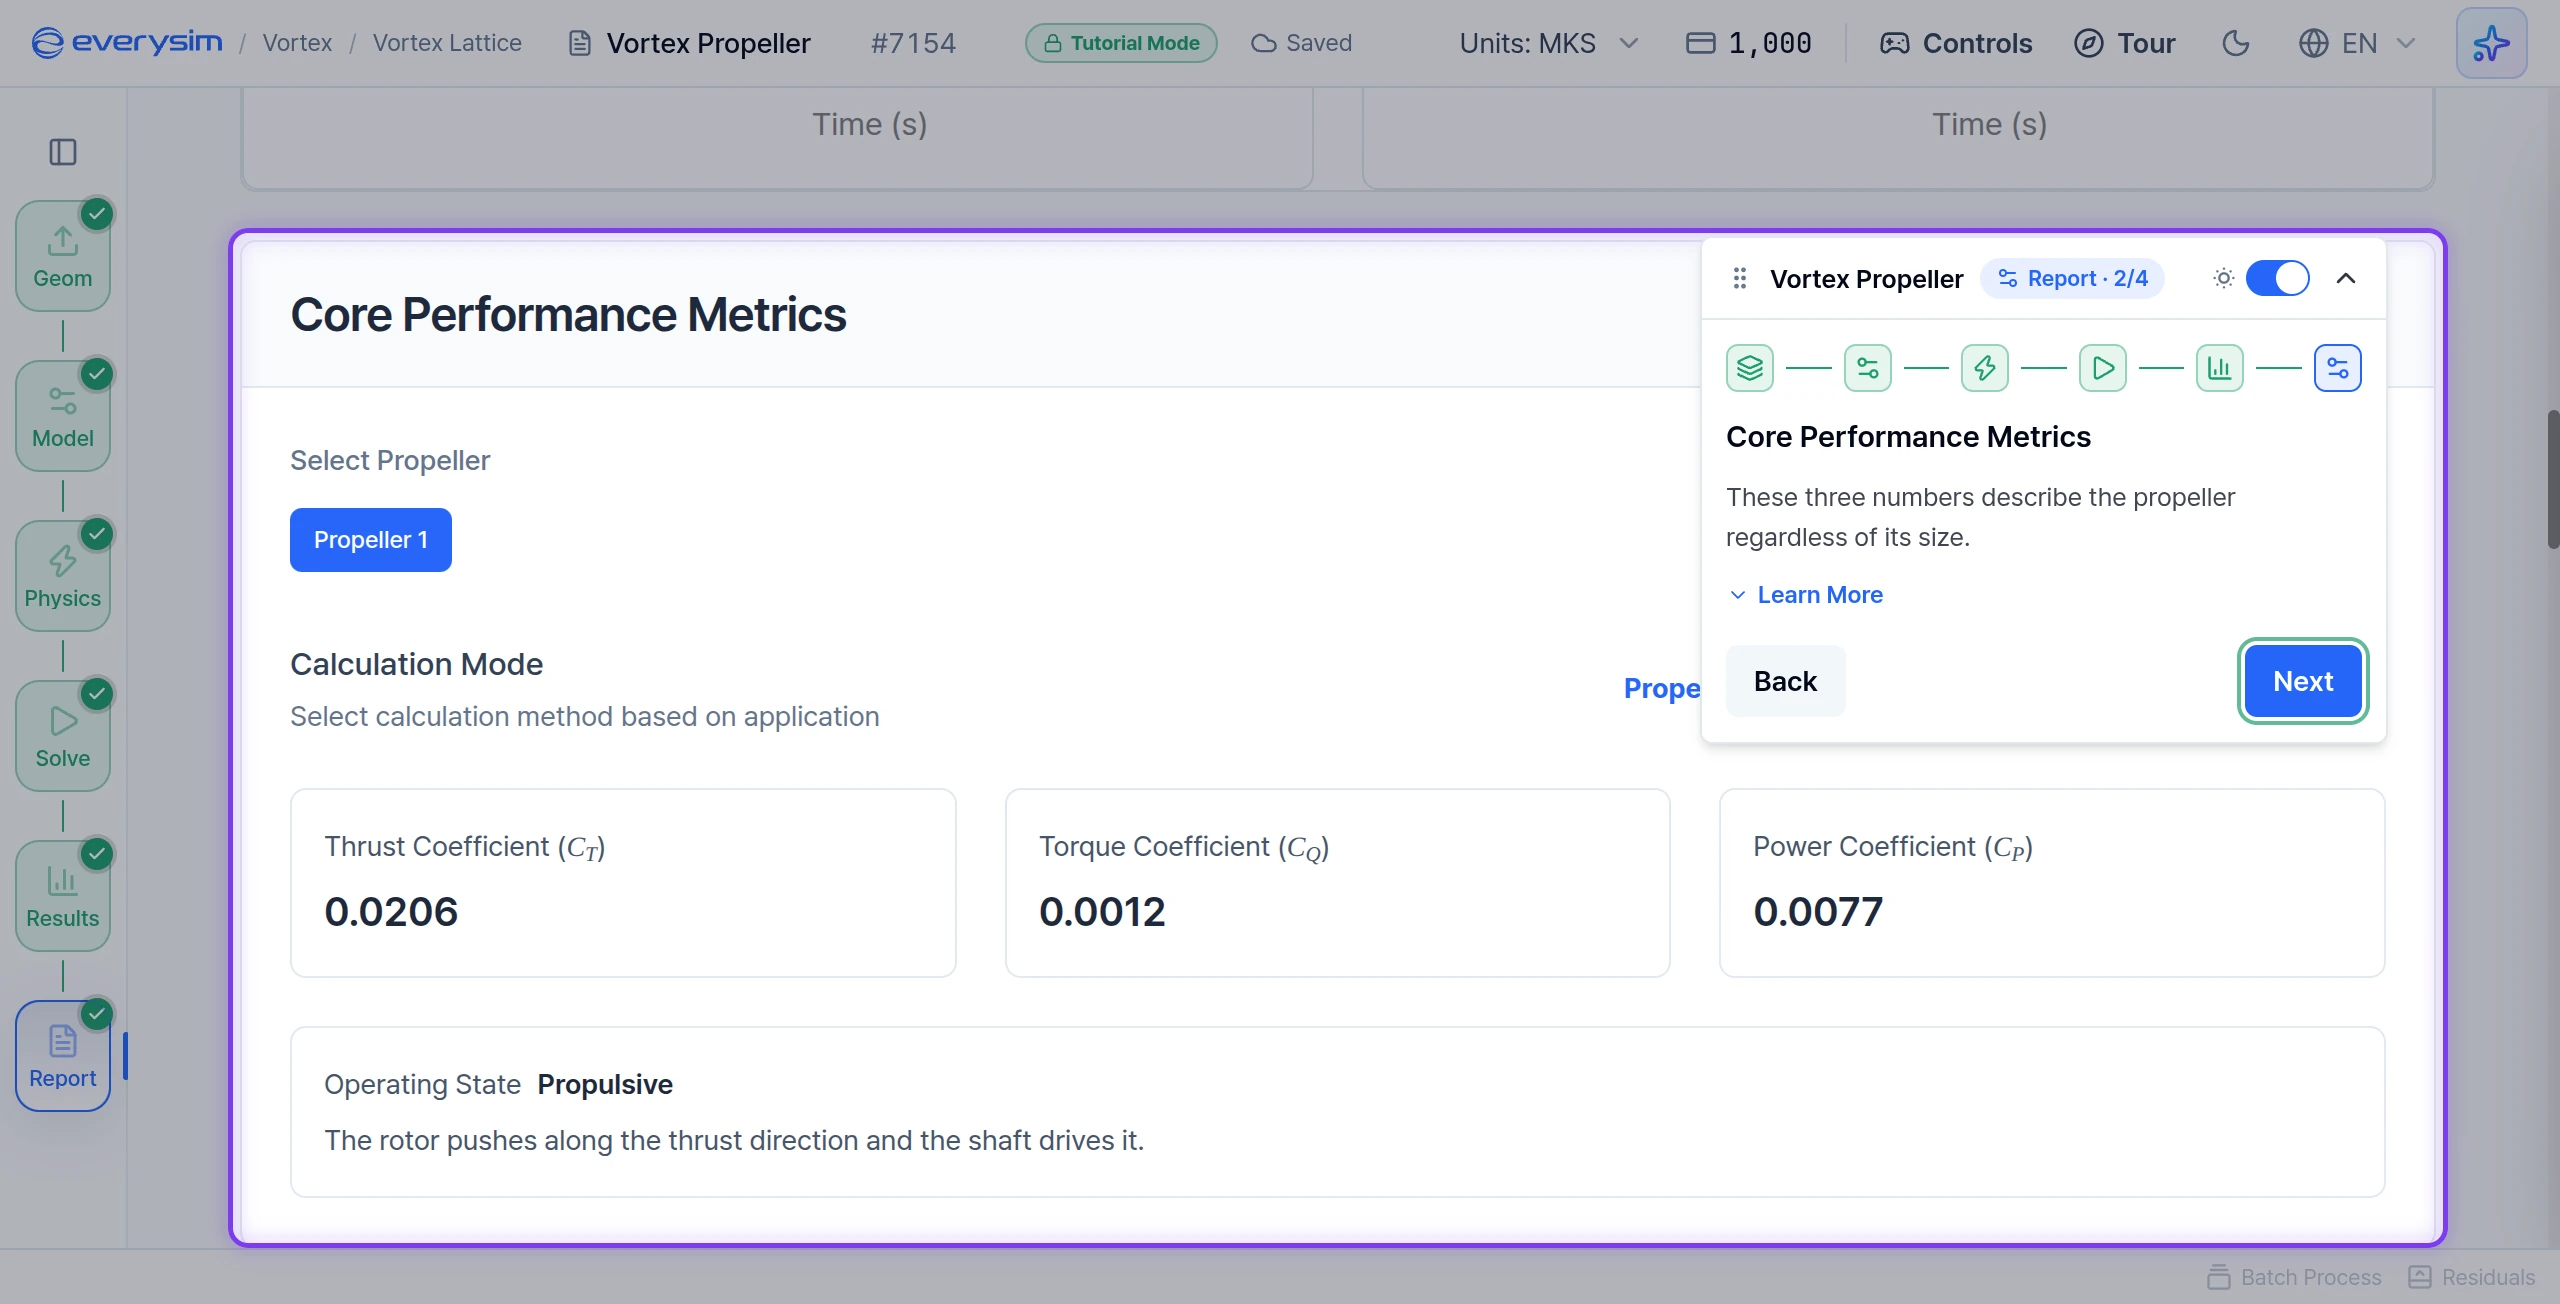
These three numbers describe the propeller regardless of its size.
| Coefficient | Report reading | Meaning |
|---|---|---|
| Thrust Coefficient (CT) | 0.0206 | How much thrust it produces |
| Torque Coefficient (CQ) | 0.0012 | How much torque it takes to turn |
| Power Coefficient (CP) | 0.0077 | How much power it takes to turn |
Operating State says what the rotor is doing. Here it is Propulsive: the motor drives it and it pushes the way it is meant to.
Click Next.
Performance Summary
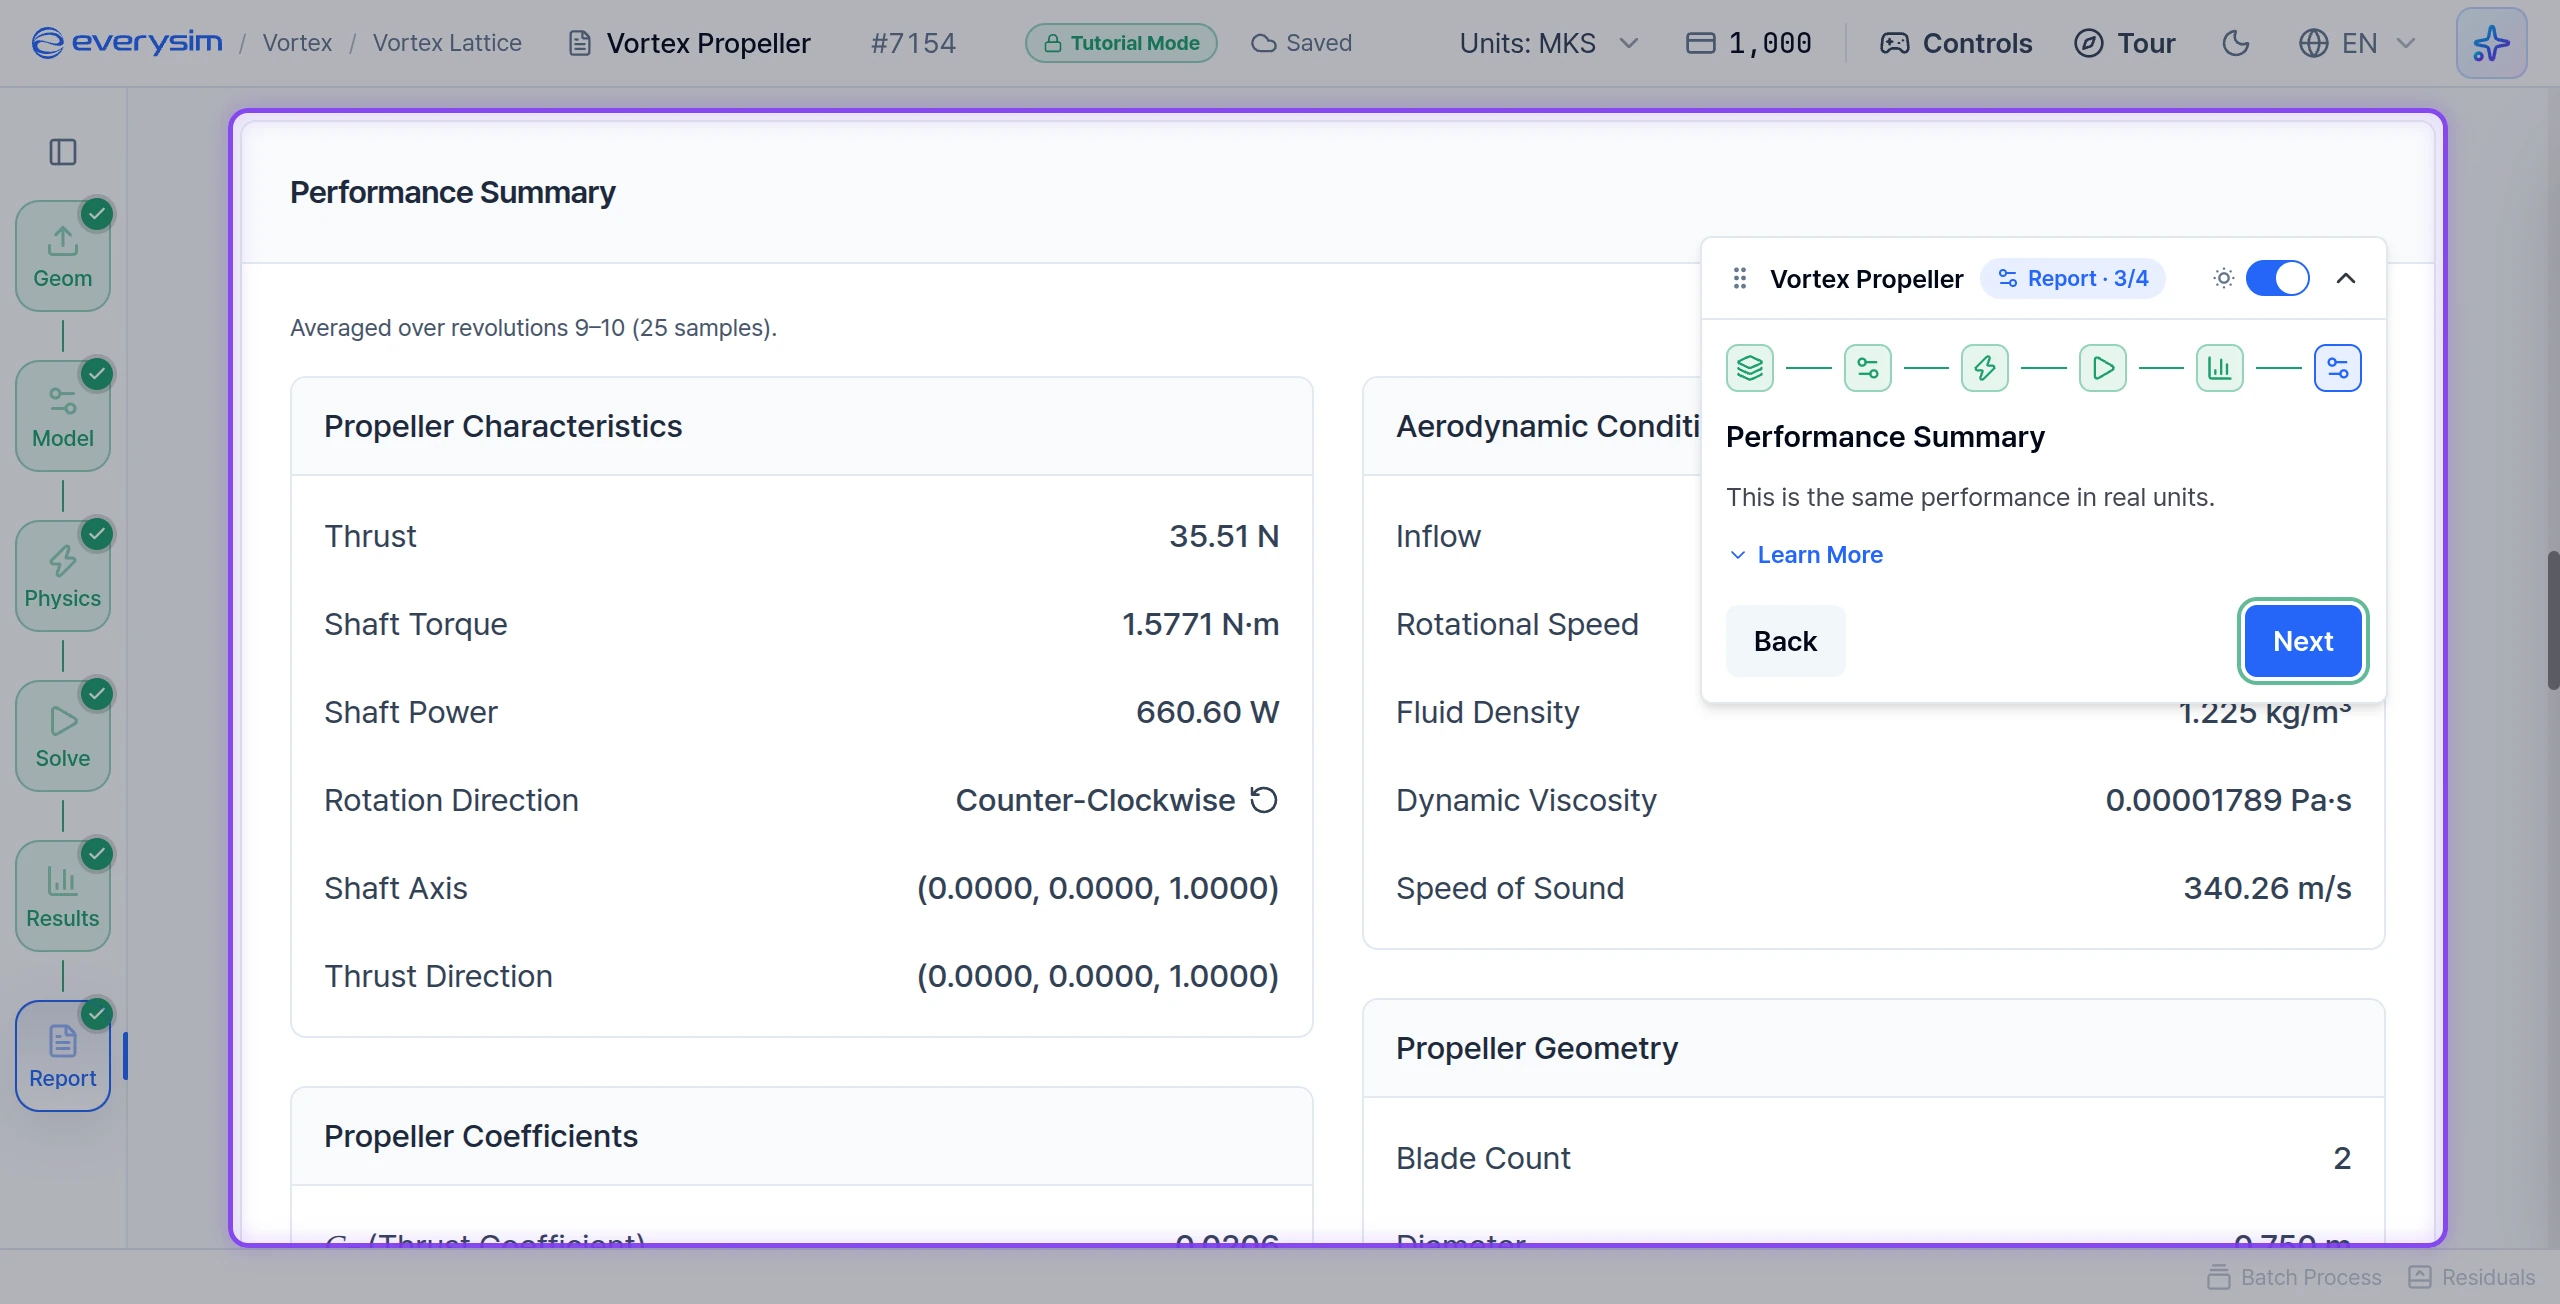
This is the same performance in real units, averaged over revolutions 9 to 10 (25 samples).
| Value | Report reading | Meaning |
|---|---|---|
| Thrust | 35.51 N | The force the propeller produces, positive in its thrust direction |
| Shaft Torque | 1.5771 N·m | What the motor must deliver to keep it turning at this RPM |
| Shaft Power | 660.60 W | What the motor must deliver to keep it turning at this RPM |
The guide card says about 36 N and about 670 W. The report's 660.60 W is the value to use: it equals the shaft torque times the rotation speed.
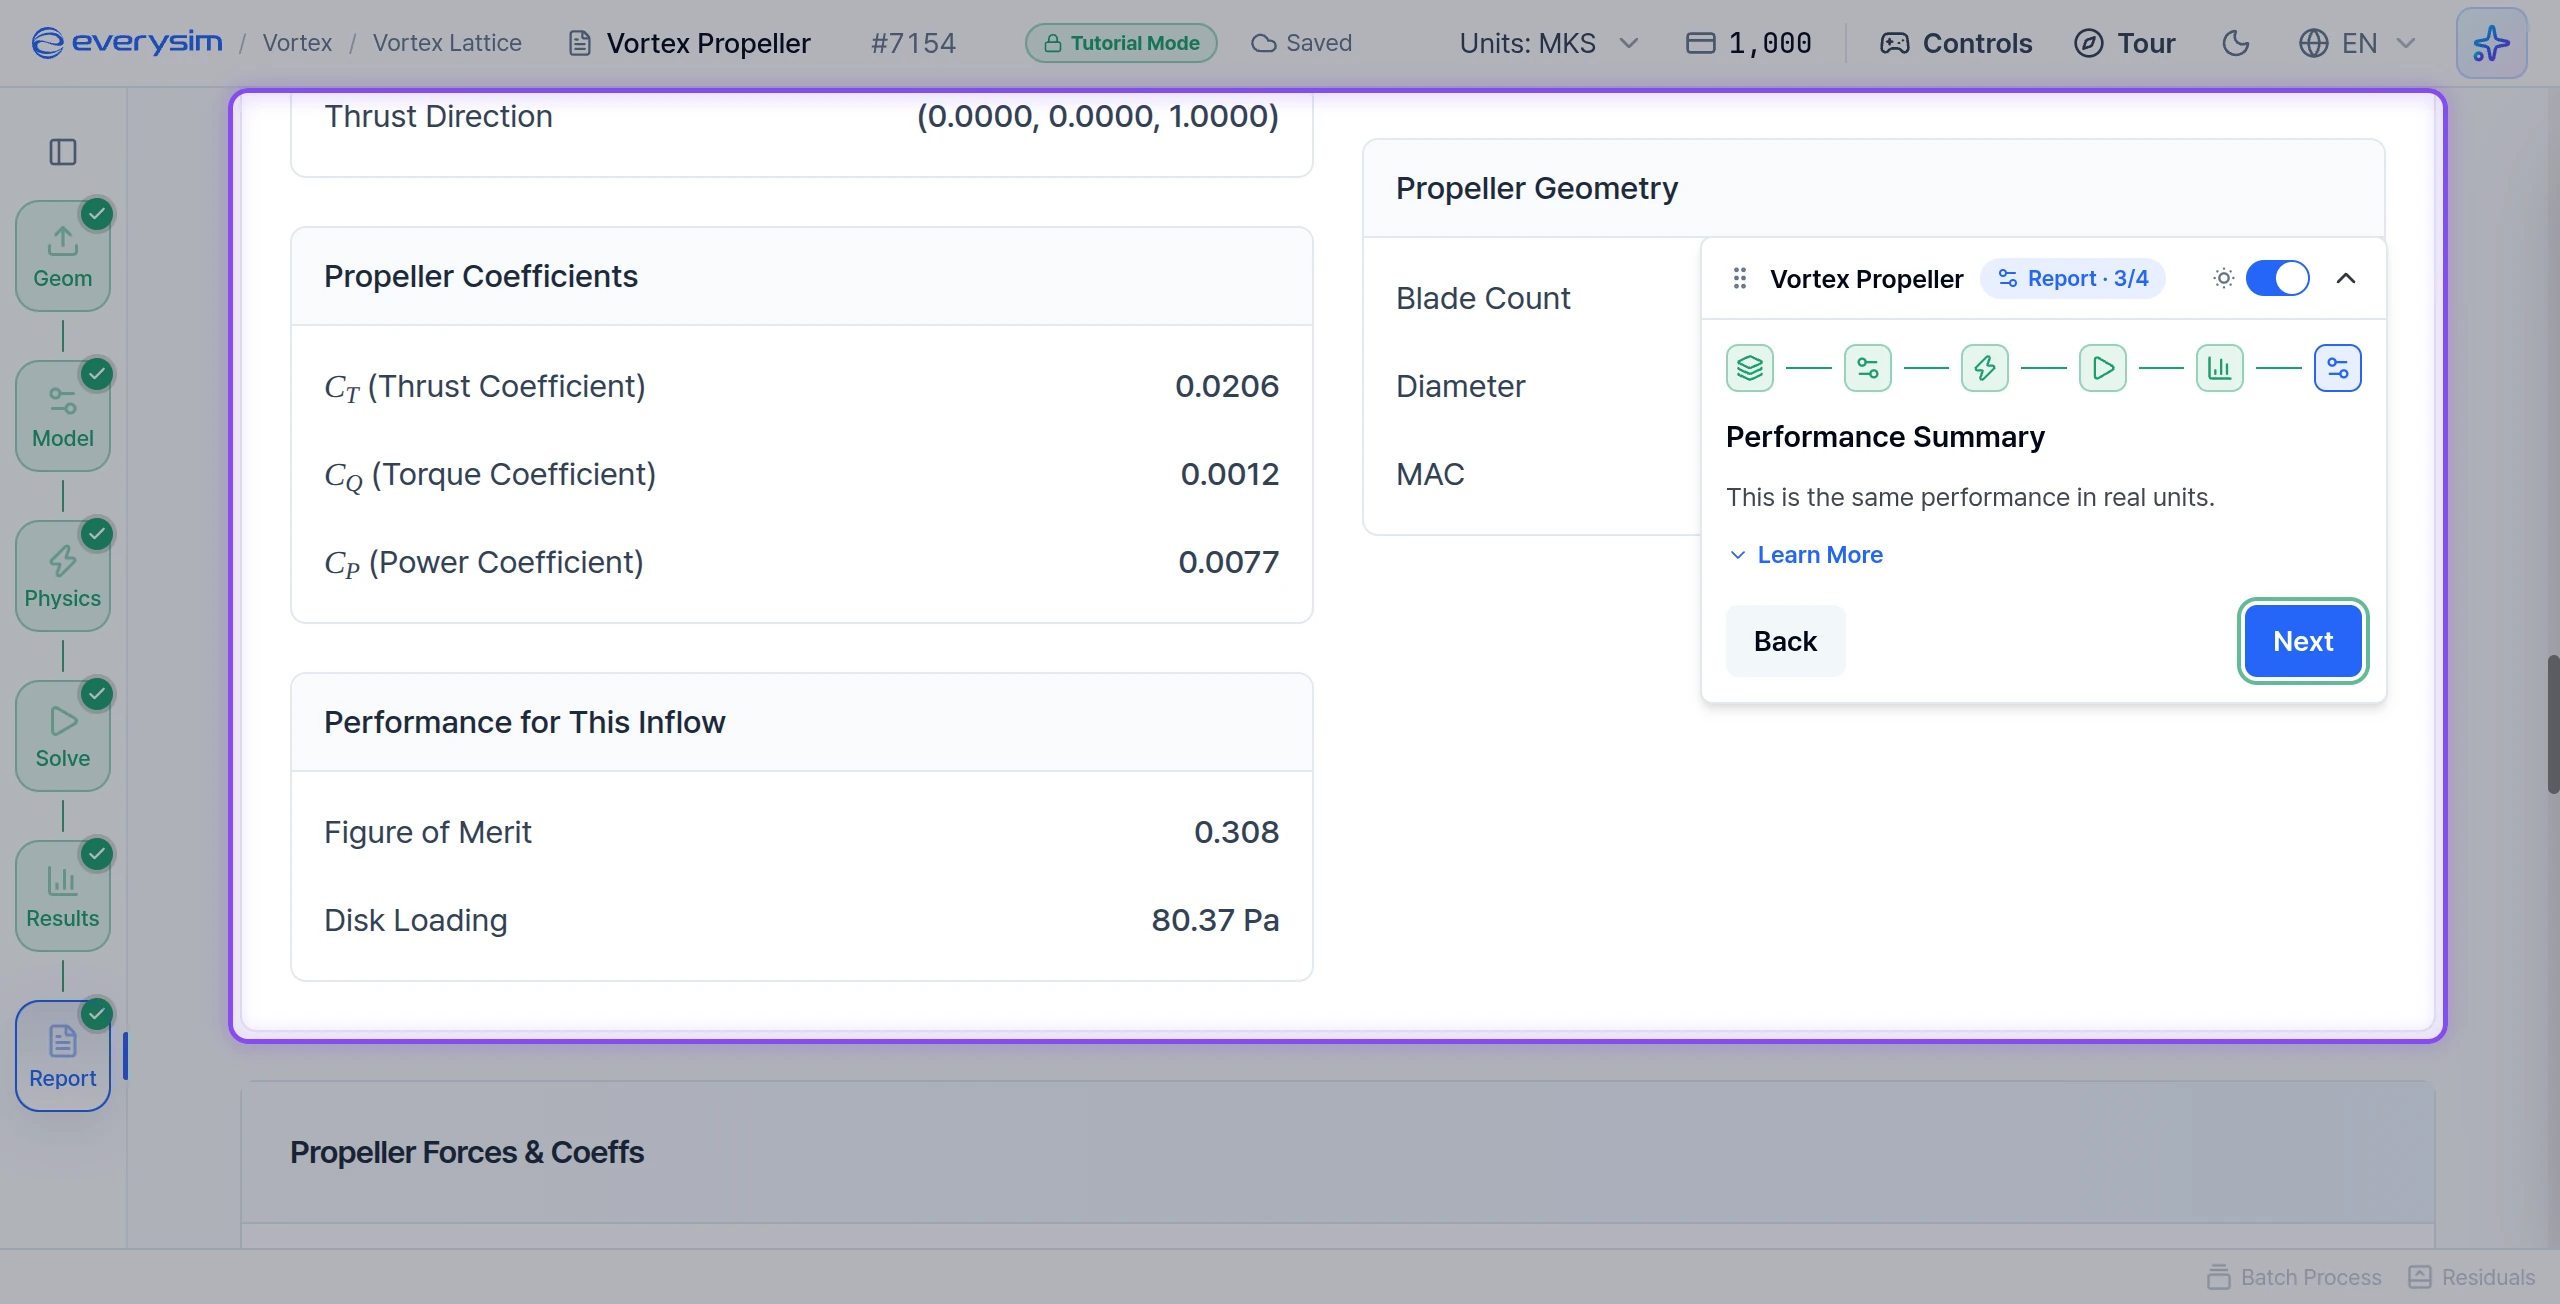
Performance for This Inflow adds two hover numbers. Figure of Merit reads 0.308. It shows how efficiently power is turned into thrust, should be between 0 and 1, and higher is better. Disk Loading reads 80.37 Pa, the thrust divided by the disk area.
Click Next.
Sectional Load Distribution
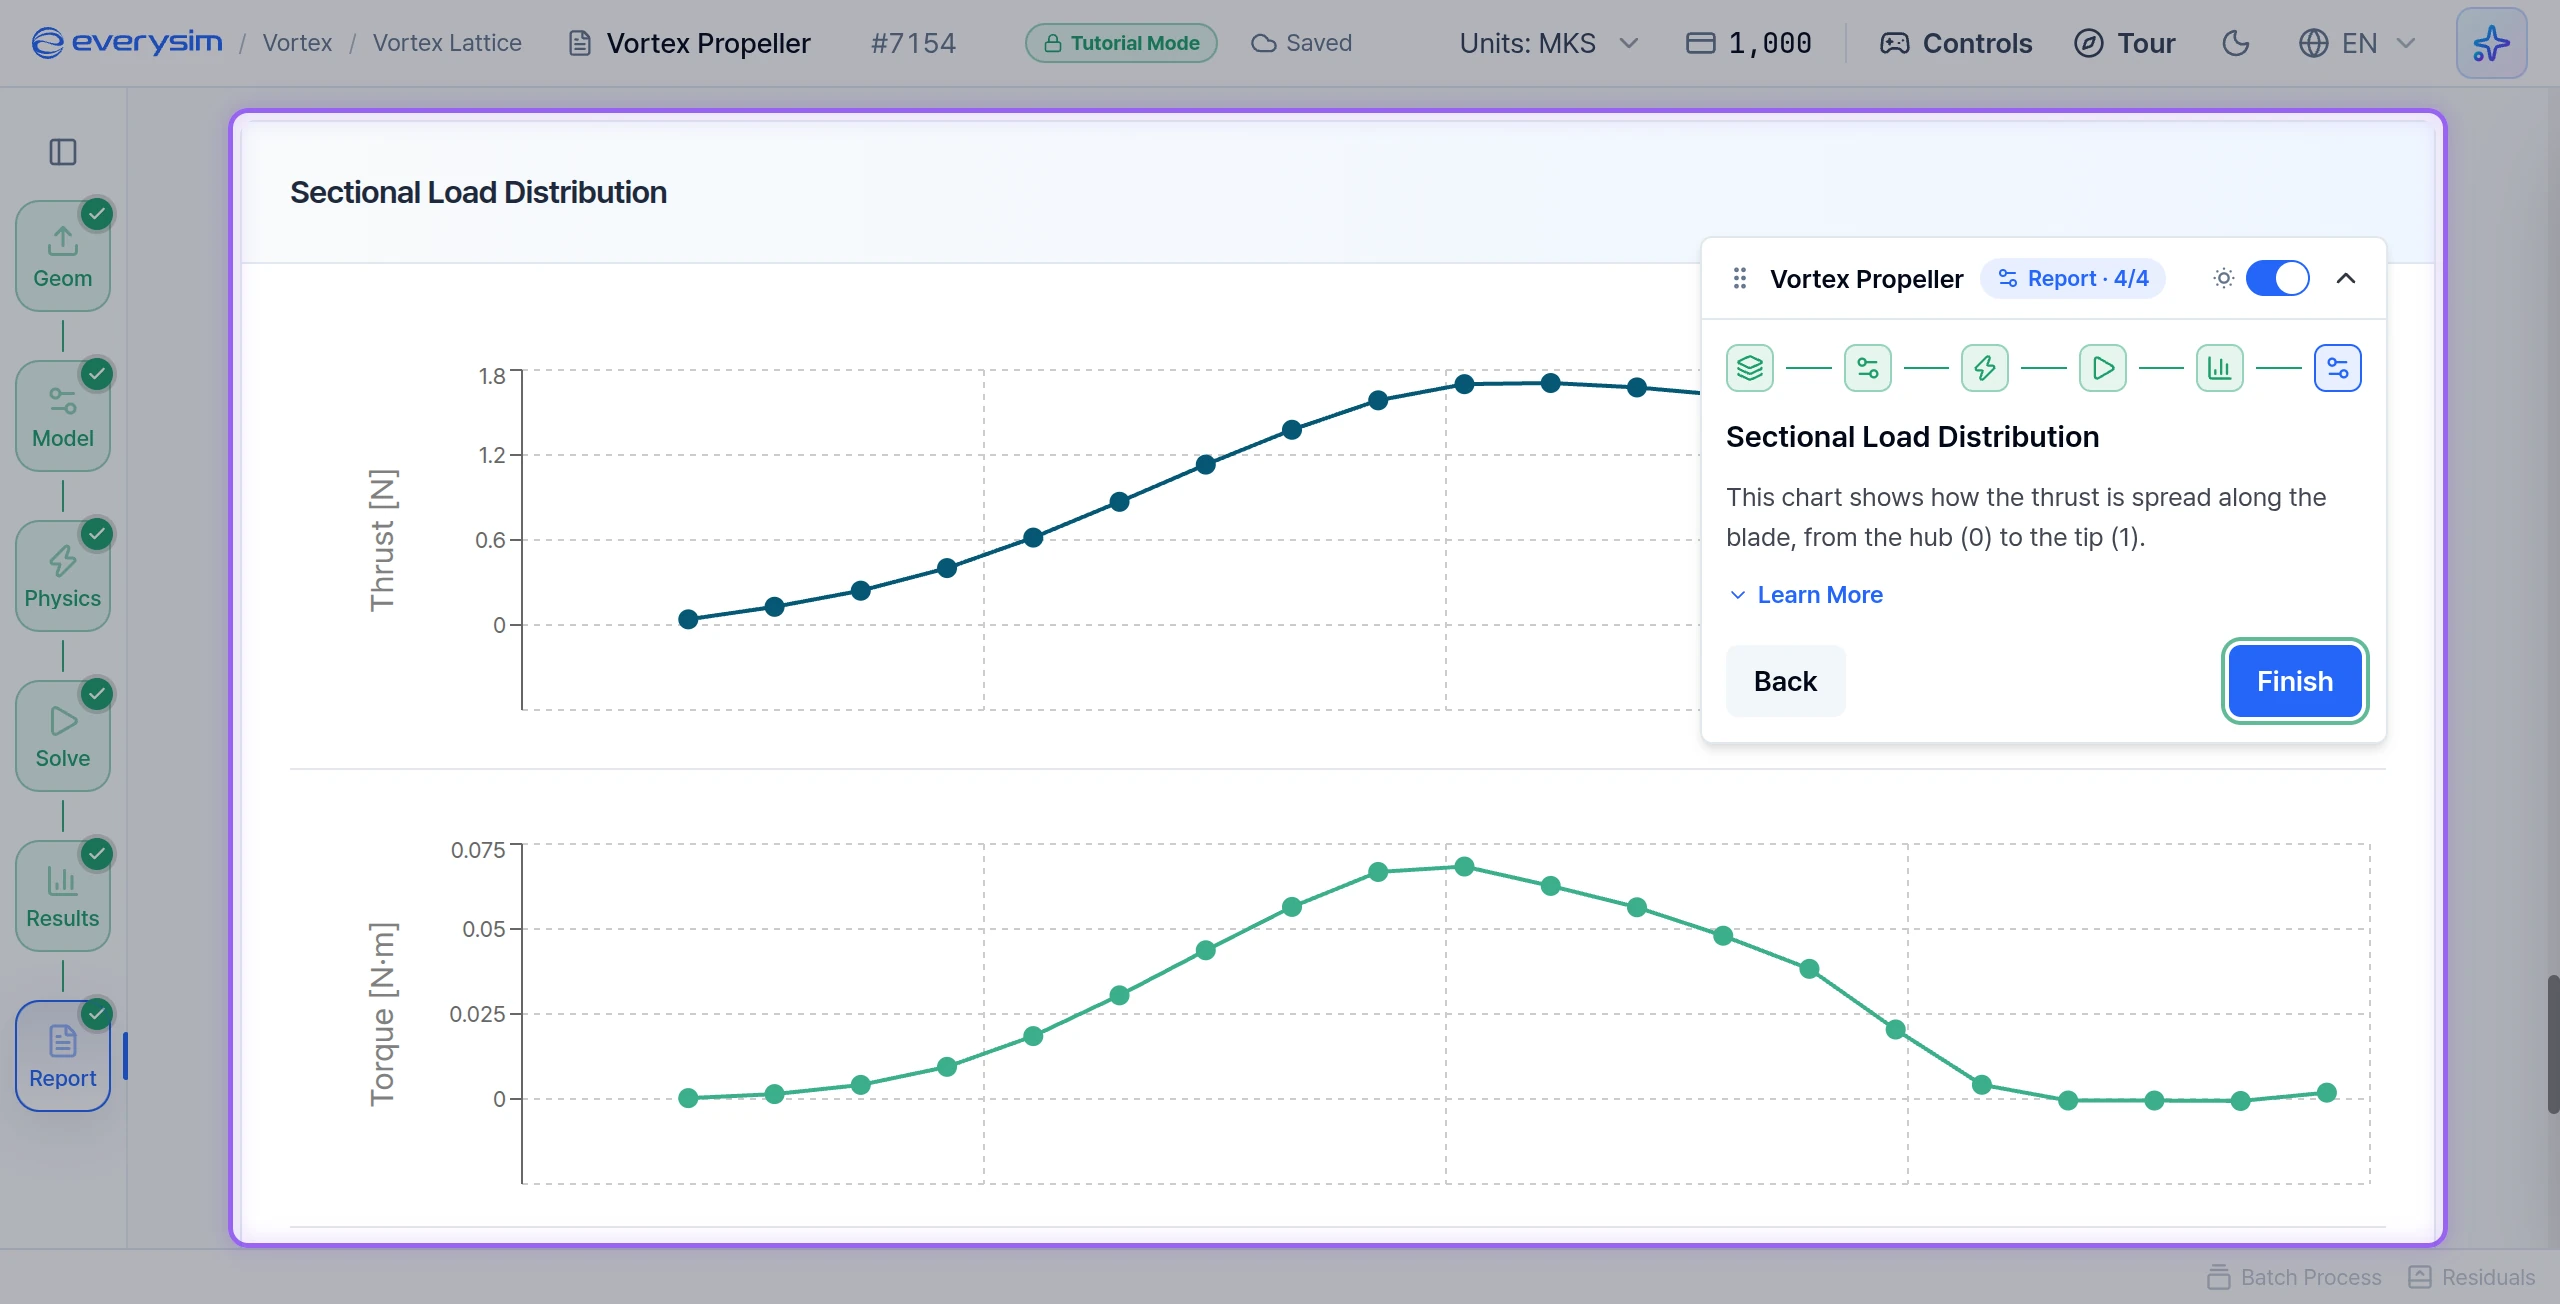
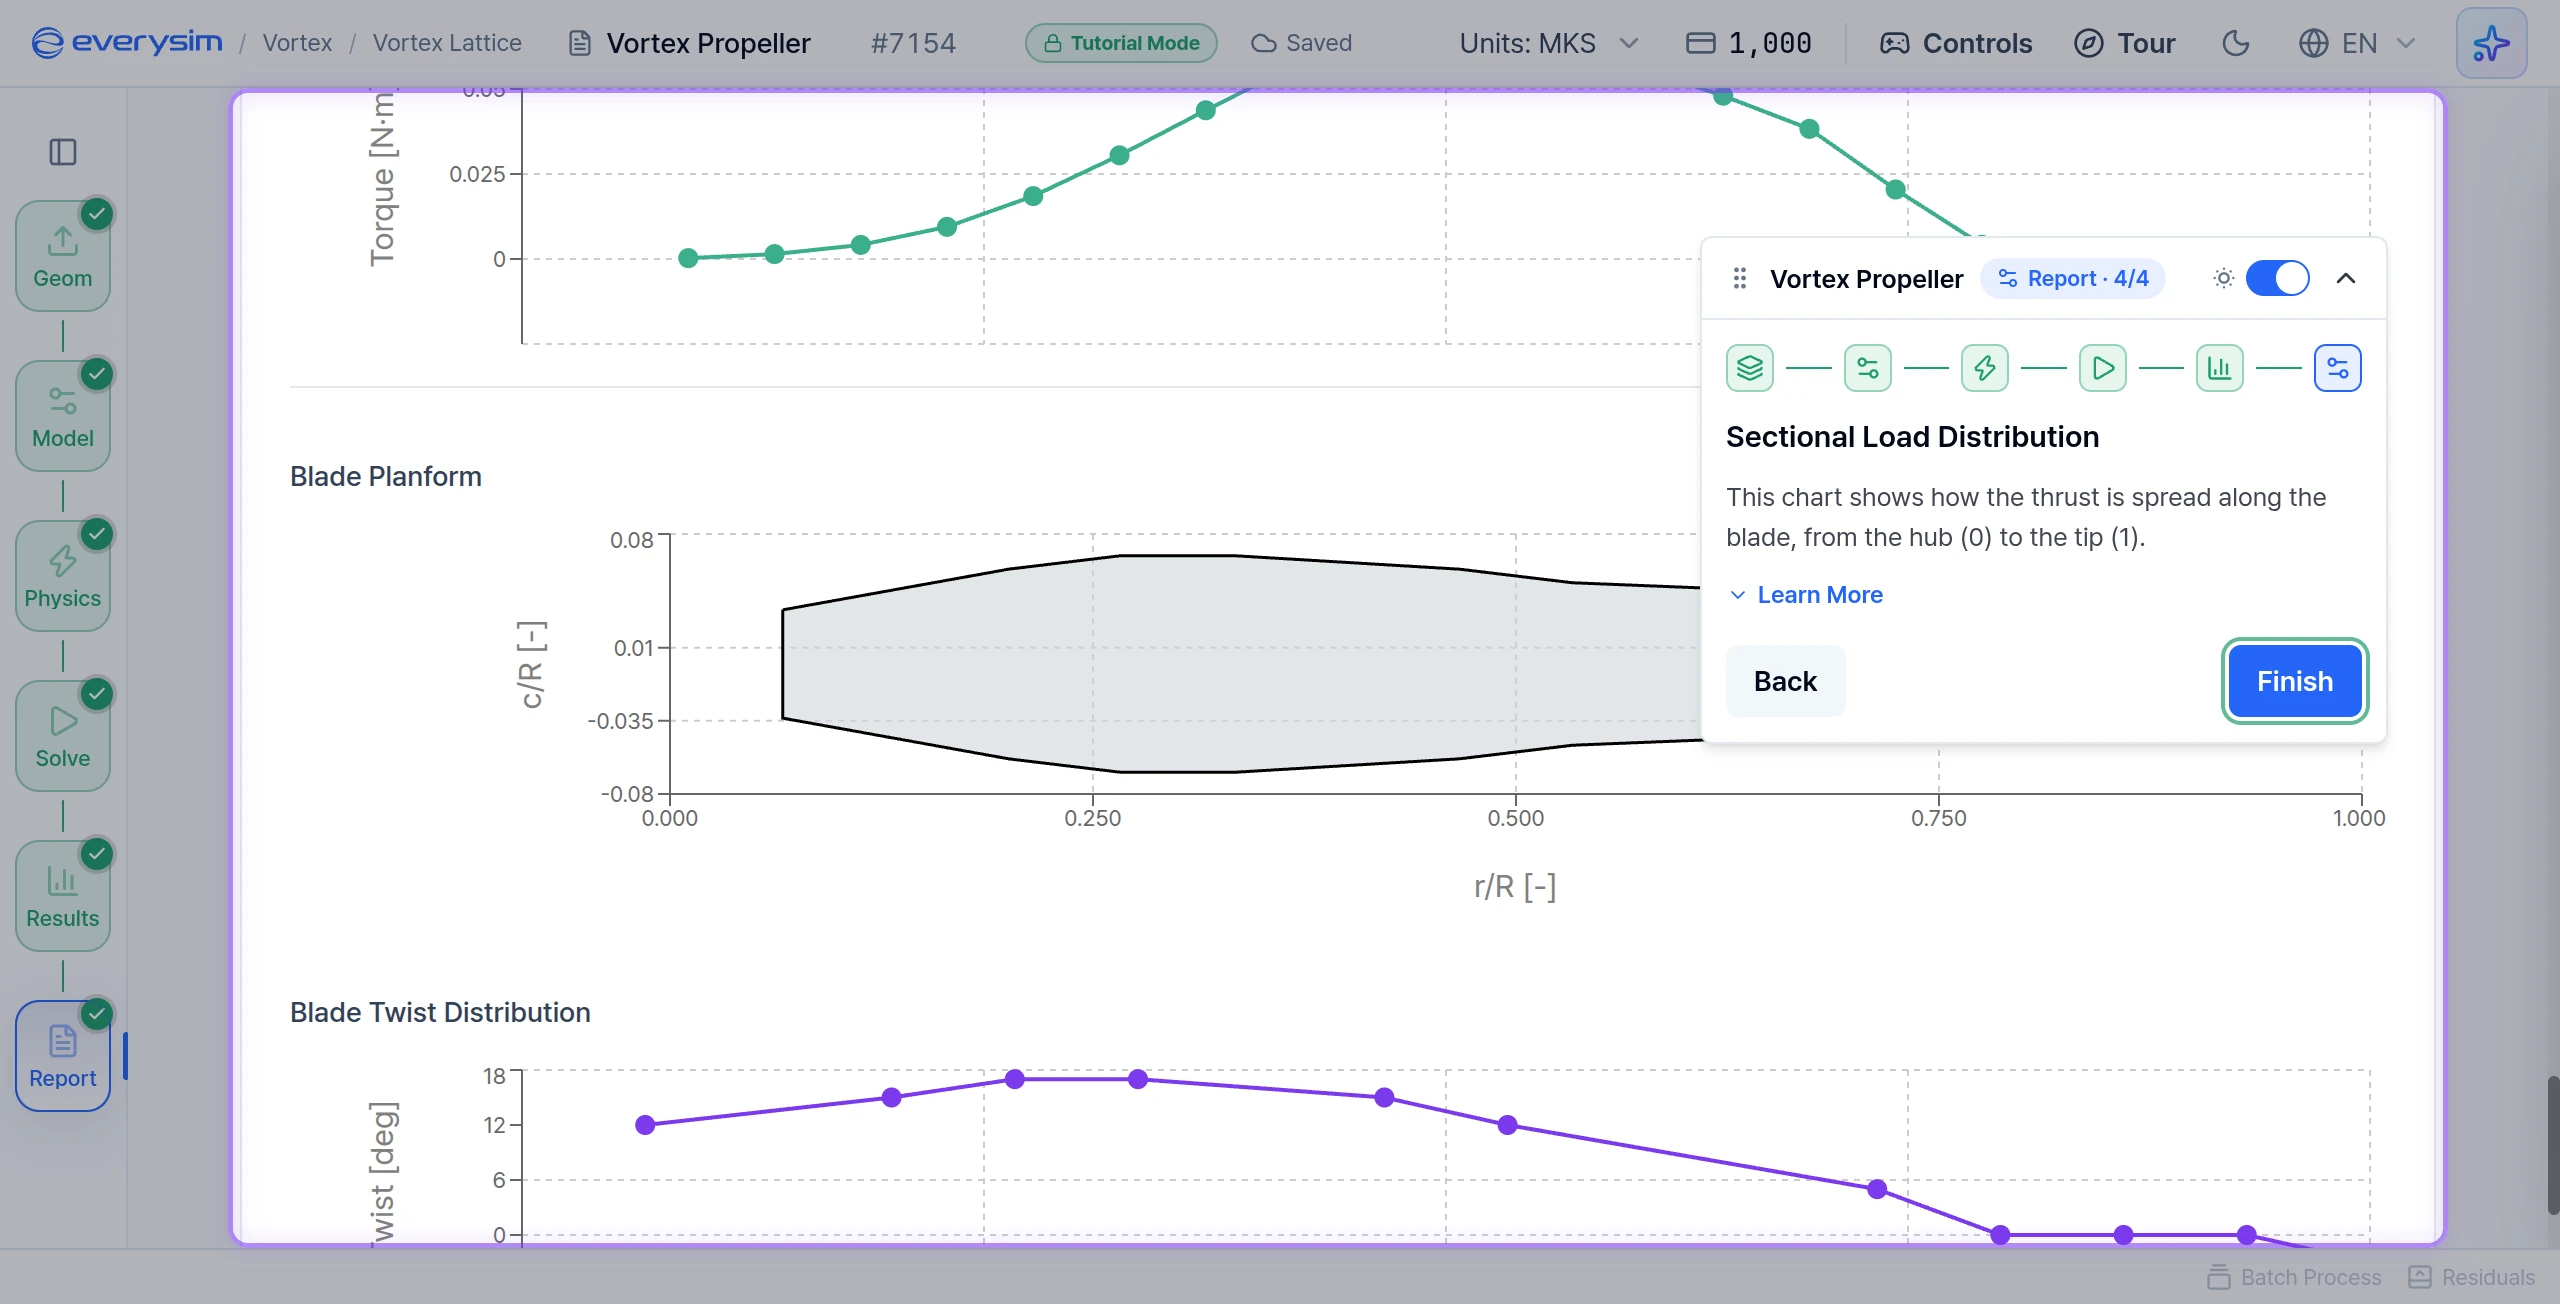
This chart shows how the thrust is spread along the blade, from the hub (0) to the tip (1). Most of the thrust comes from the middle of the blade, about 40 to 70 percent of the radius. Toward the tip it falls off quickly as the blade narrows, reaching -0.25 N at r/R 0.977. Blade Planform further down shows the chord is largest further in, near r/R 0.27 to 0.33, so the thrust peak does not sit at the widest section.
Click Finish to complete the tutorial.
You now know how to set up a propeller on a body and read its thrust and wake.
Need Assistance or Have Questions?
Frequently Asked Questions: FAQ Link
Support Inquiries: support@everysim.io