Static Structural
This tutorial tests how a titanium bracket behaves when one of its lugs is pushed sideways. You assign the material, fix the bottom of the base plate, apply a 100 kN force to one lug, then read the stress, the deformation animation and the report. It takes about 15 minutes.
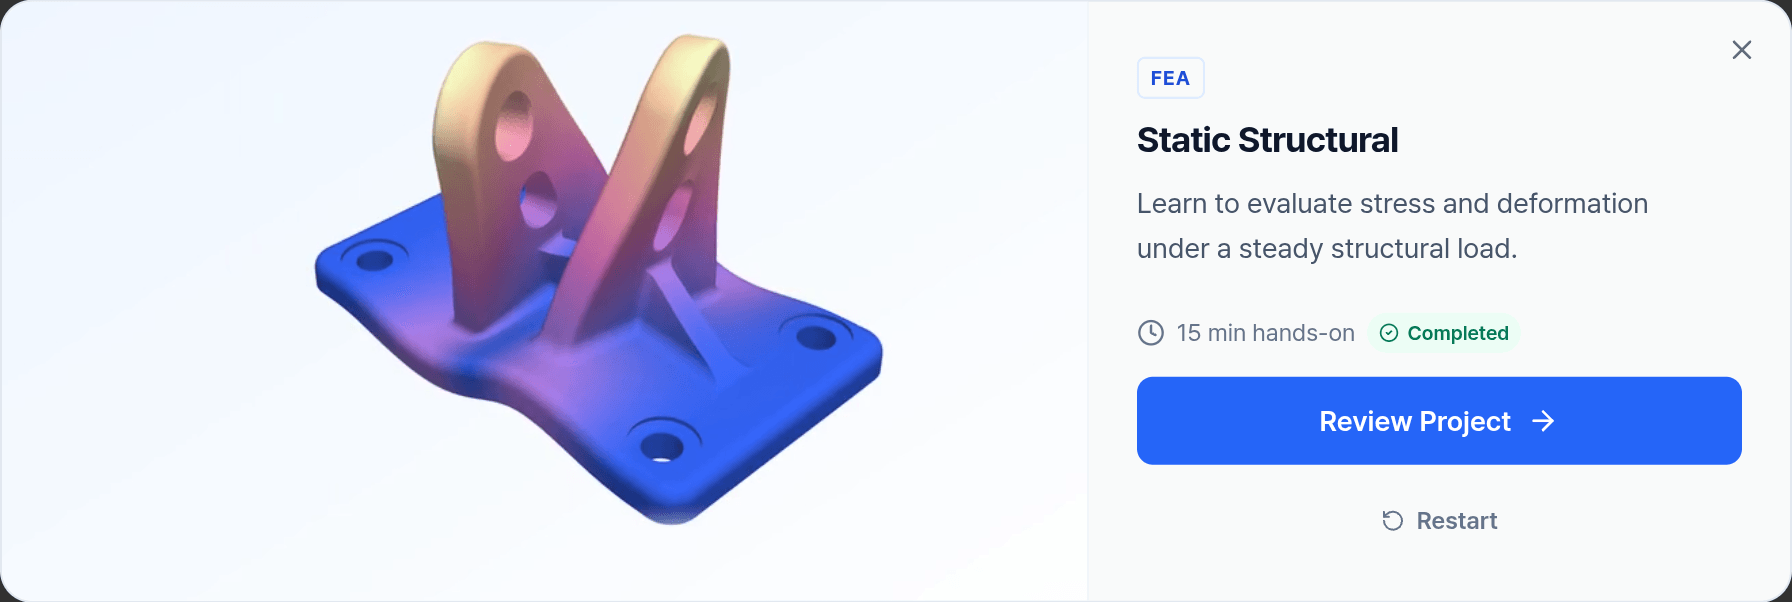
Start it from Tutorials in the dashboard. A guide card leads you through each page. Only the control a task highlights accepts clicks, and Next unlocks once the page's tasks are ticked. The project uses mm-t-s units: lengths in mm, stress in MPa, force in N.
What you will learn
- Assign a material and see where its yield strength comes from.
- Tell a fixed constraint from an applied load.
- Pick a face in the 3D view and enter a force by components.
- Read von Mises stress, the deformation animation and a color map.
- Read the factor of safety, the critical node and the principal stresses in the report.
1. Geometry Panel
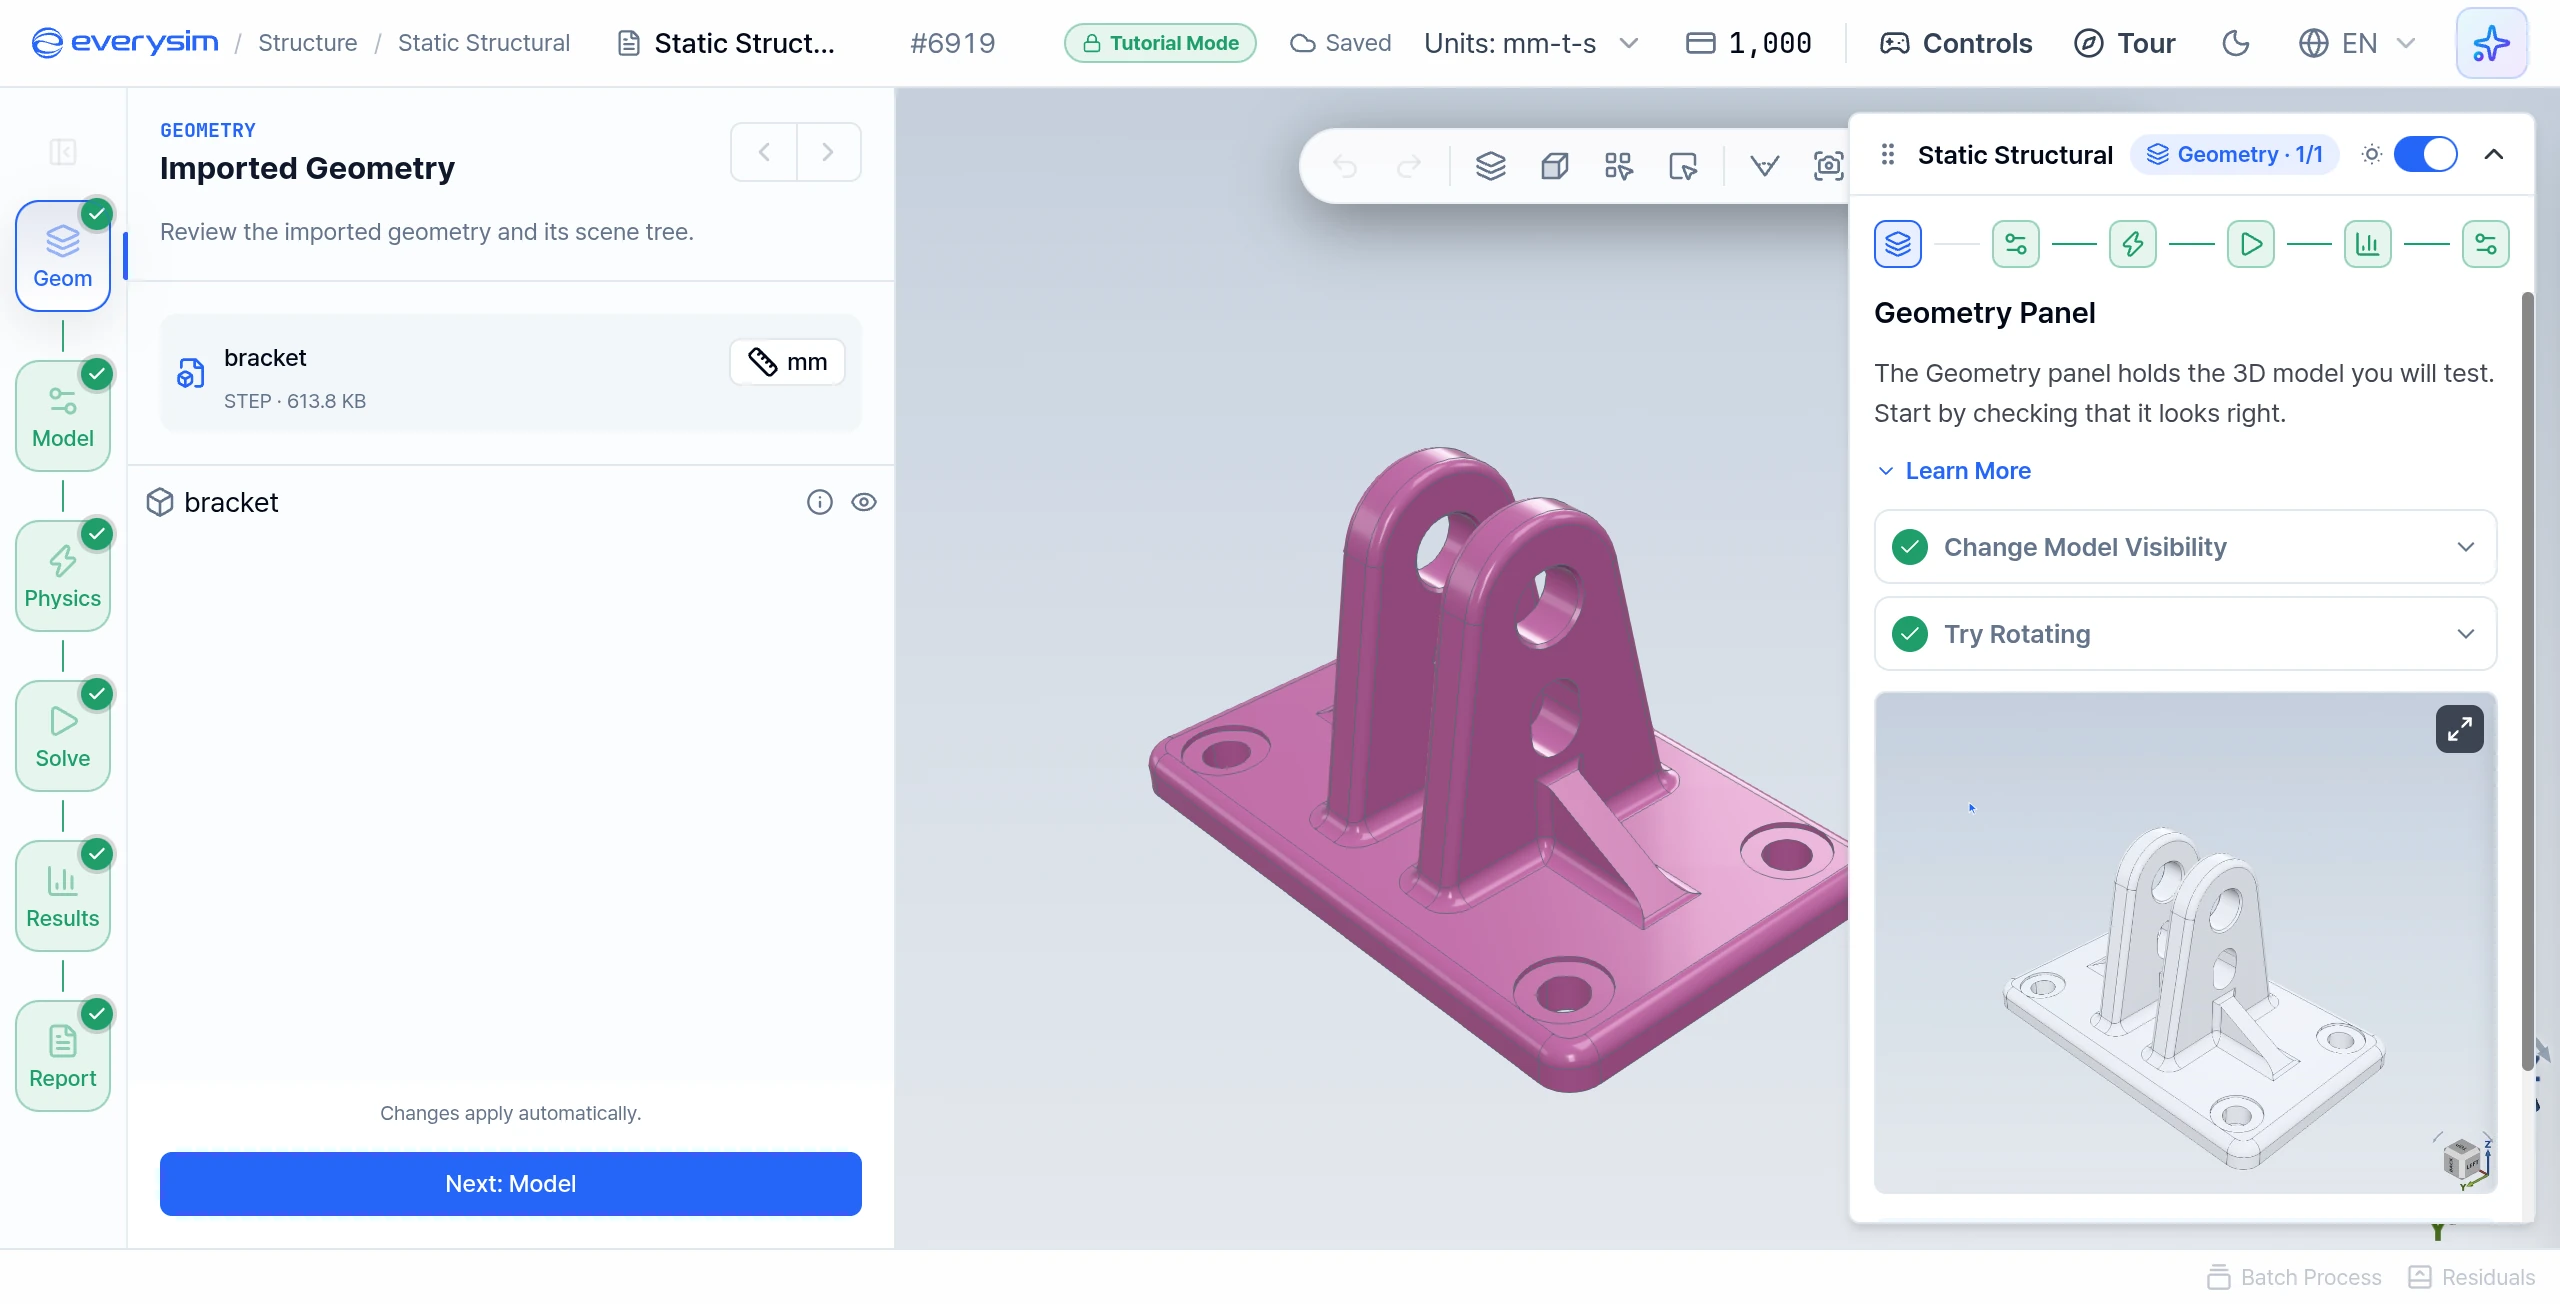
The Geometry panel holds the 3D model. The sample is a prepared bracket with a base plate and lugs, listed as bracket.
- Change Model Visibility: toggle the eye icon to hide the model, then show it again.
- Try Rotating: drag in the 3D viewport to rotate the model.
2. Material Properties
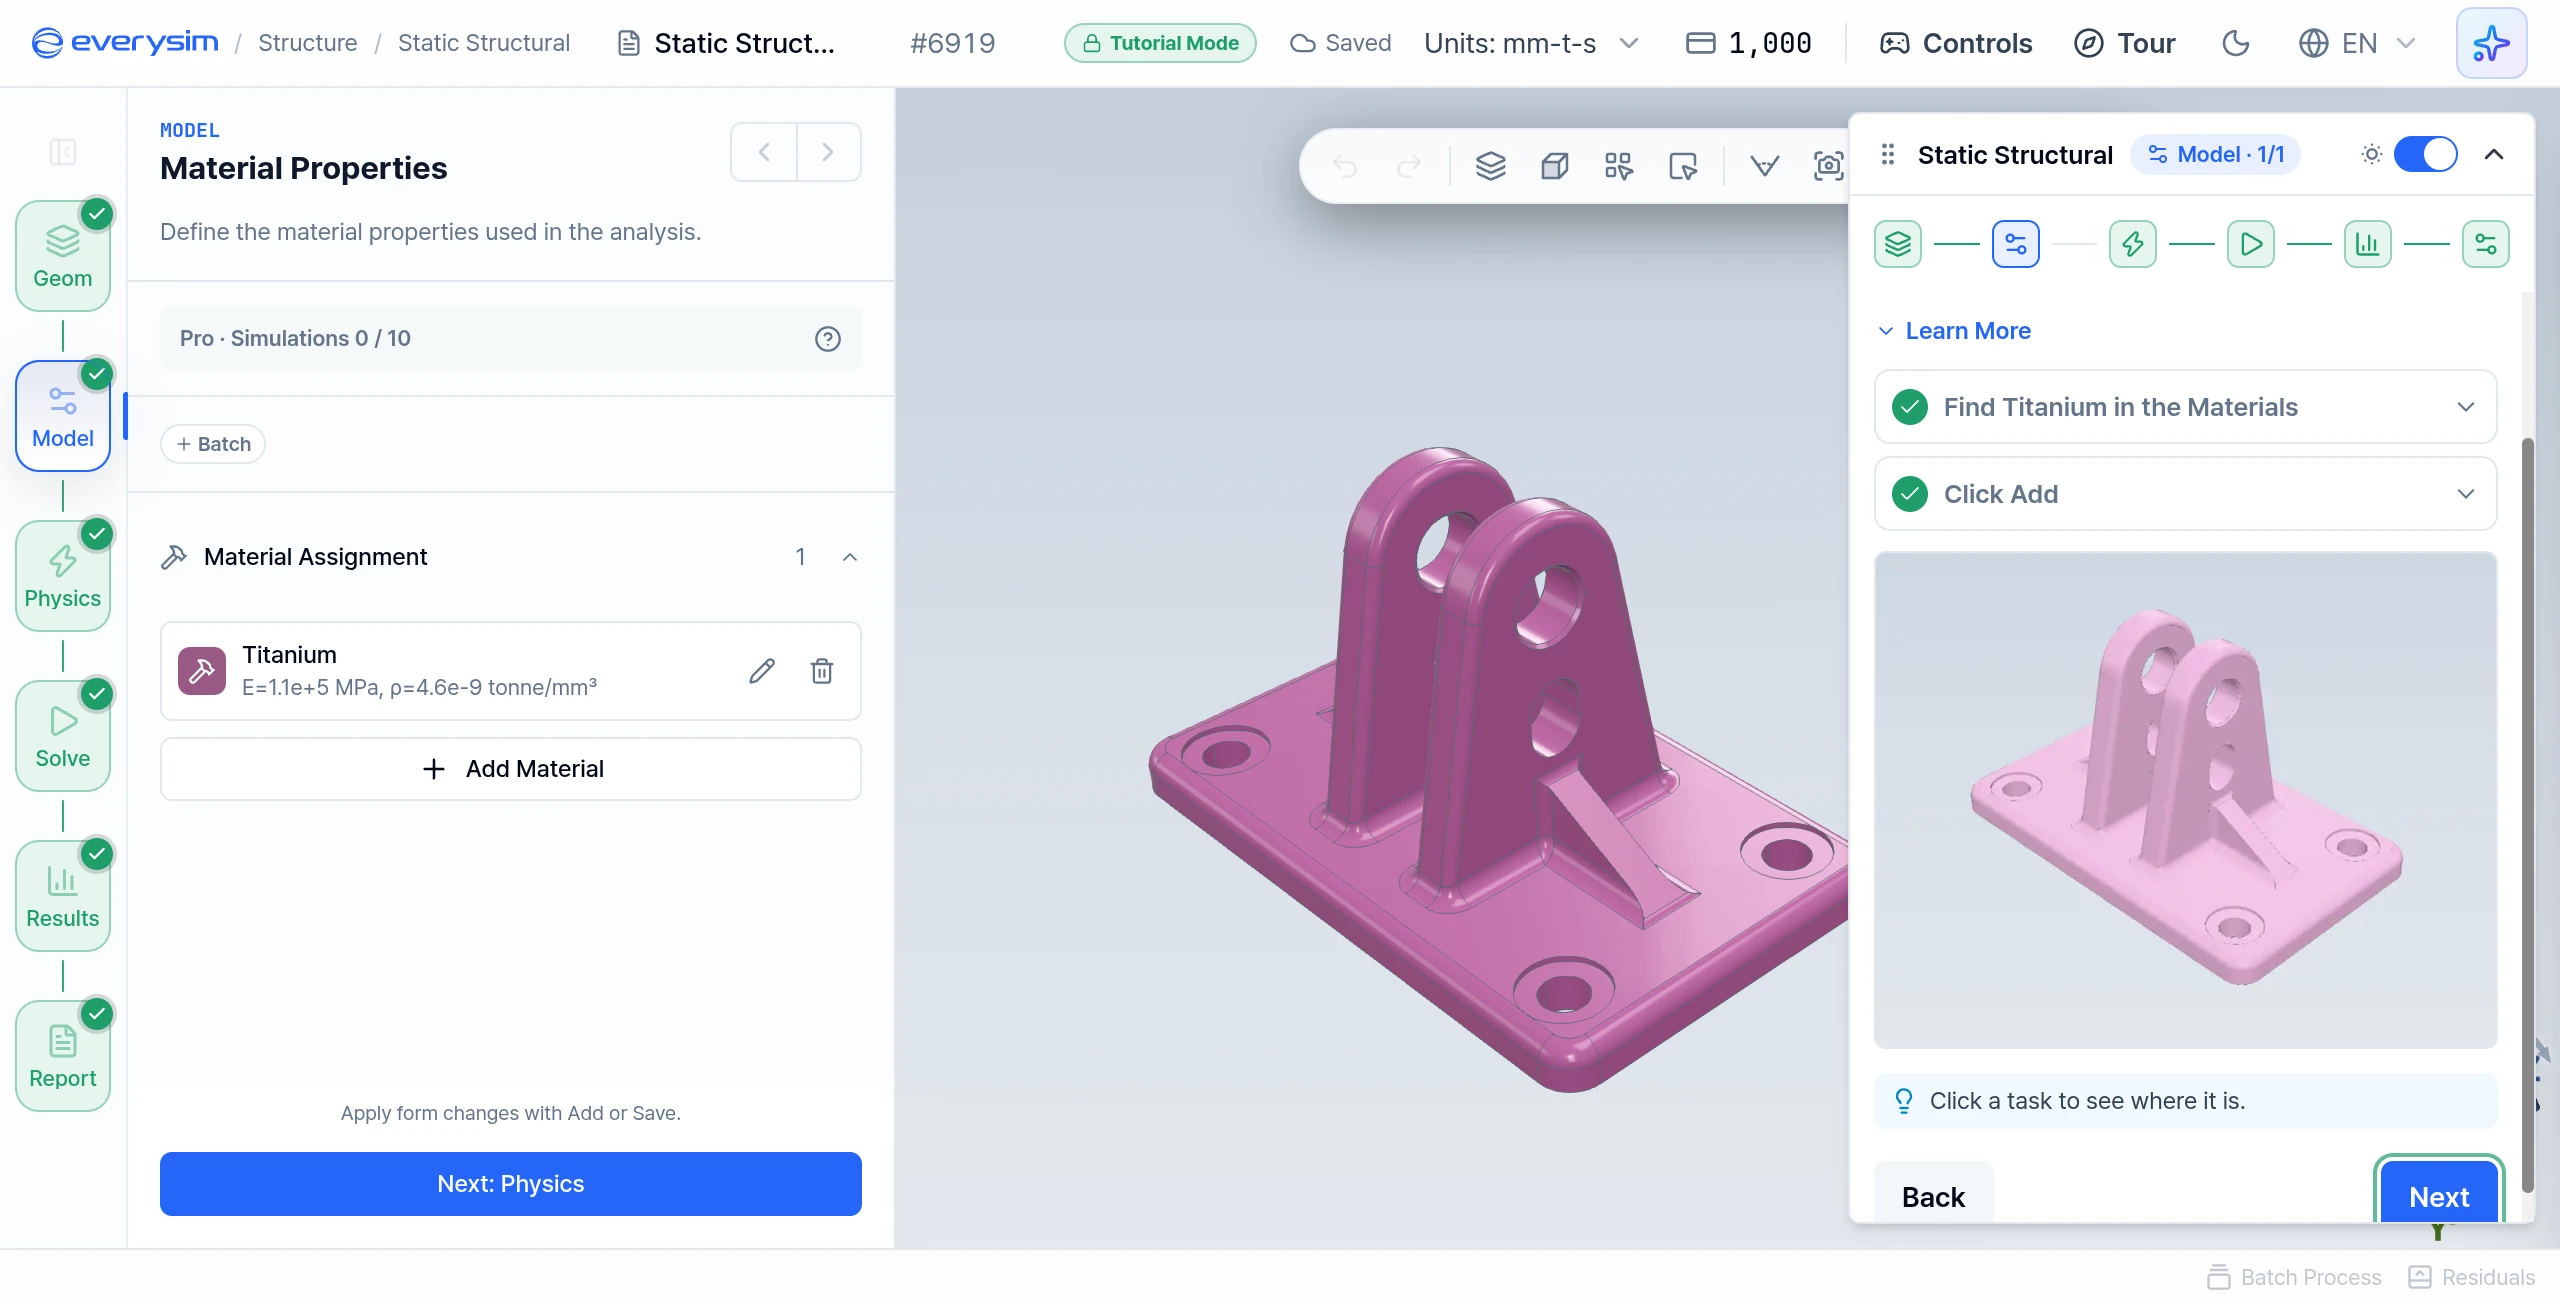
Stiffness controls how much a part deforms, and density controls its mass. The preset also carries a yield strength, the stress at which the material starts to deform permanently. The report measures the result against it.
- Find Titanium in the Materials: click Add Material, open Metals and then Other Metals, and choose Titanium.
- Click Add: check that the whole geometry is shown in the material colour, then click Add.
3. Physics Panel
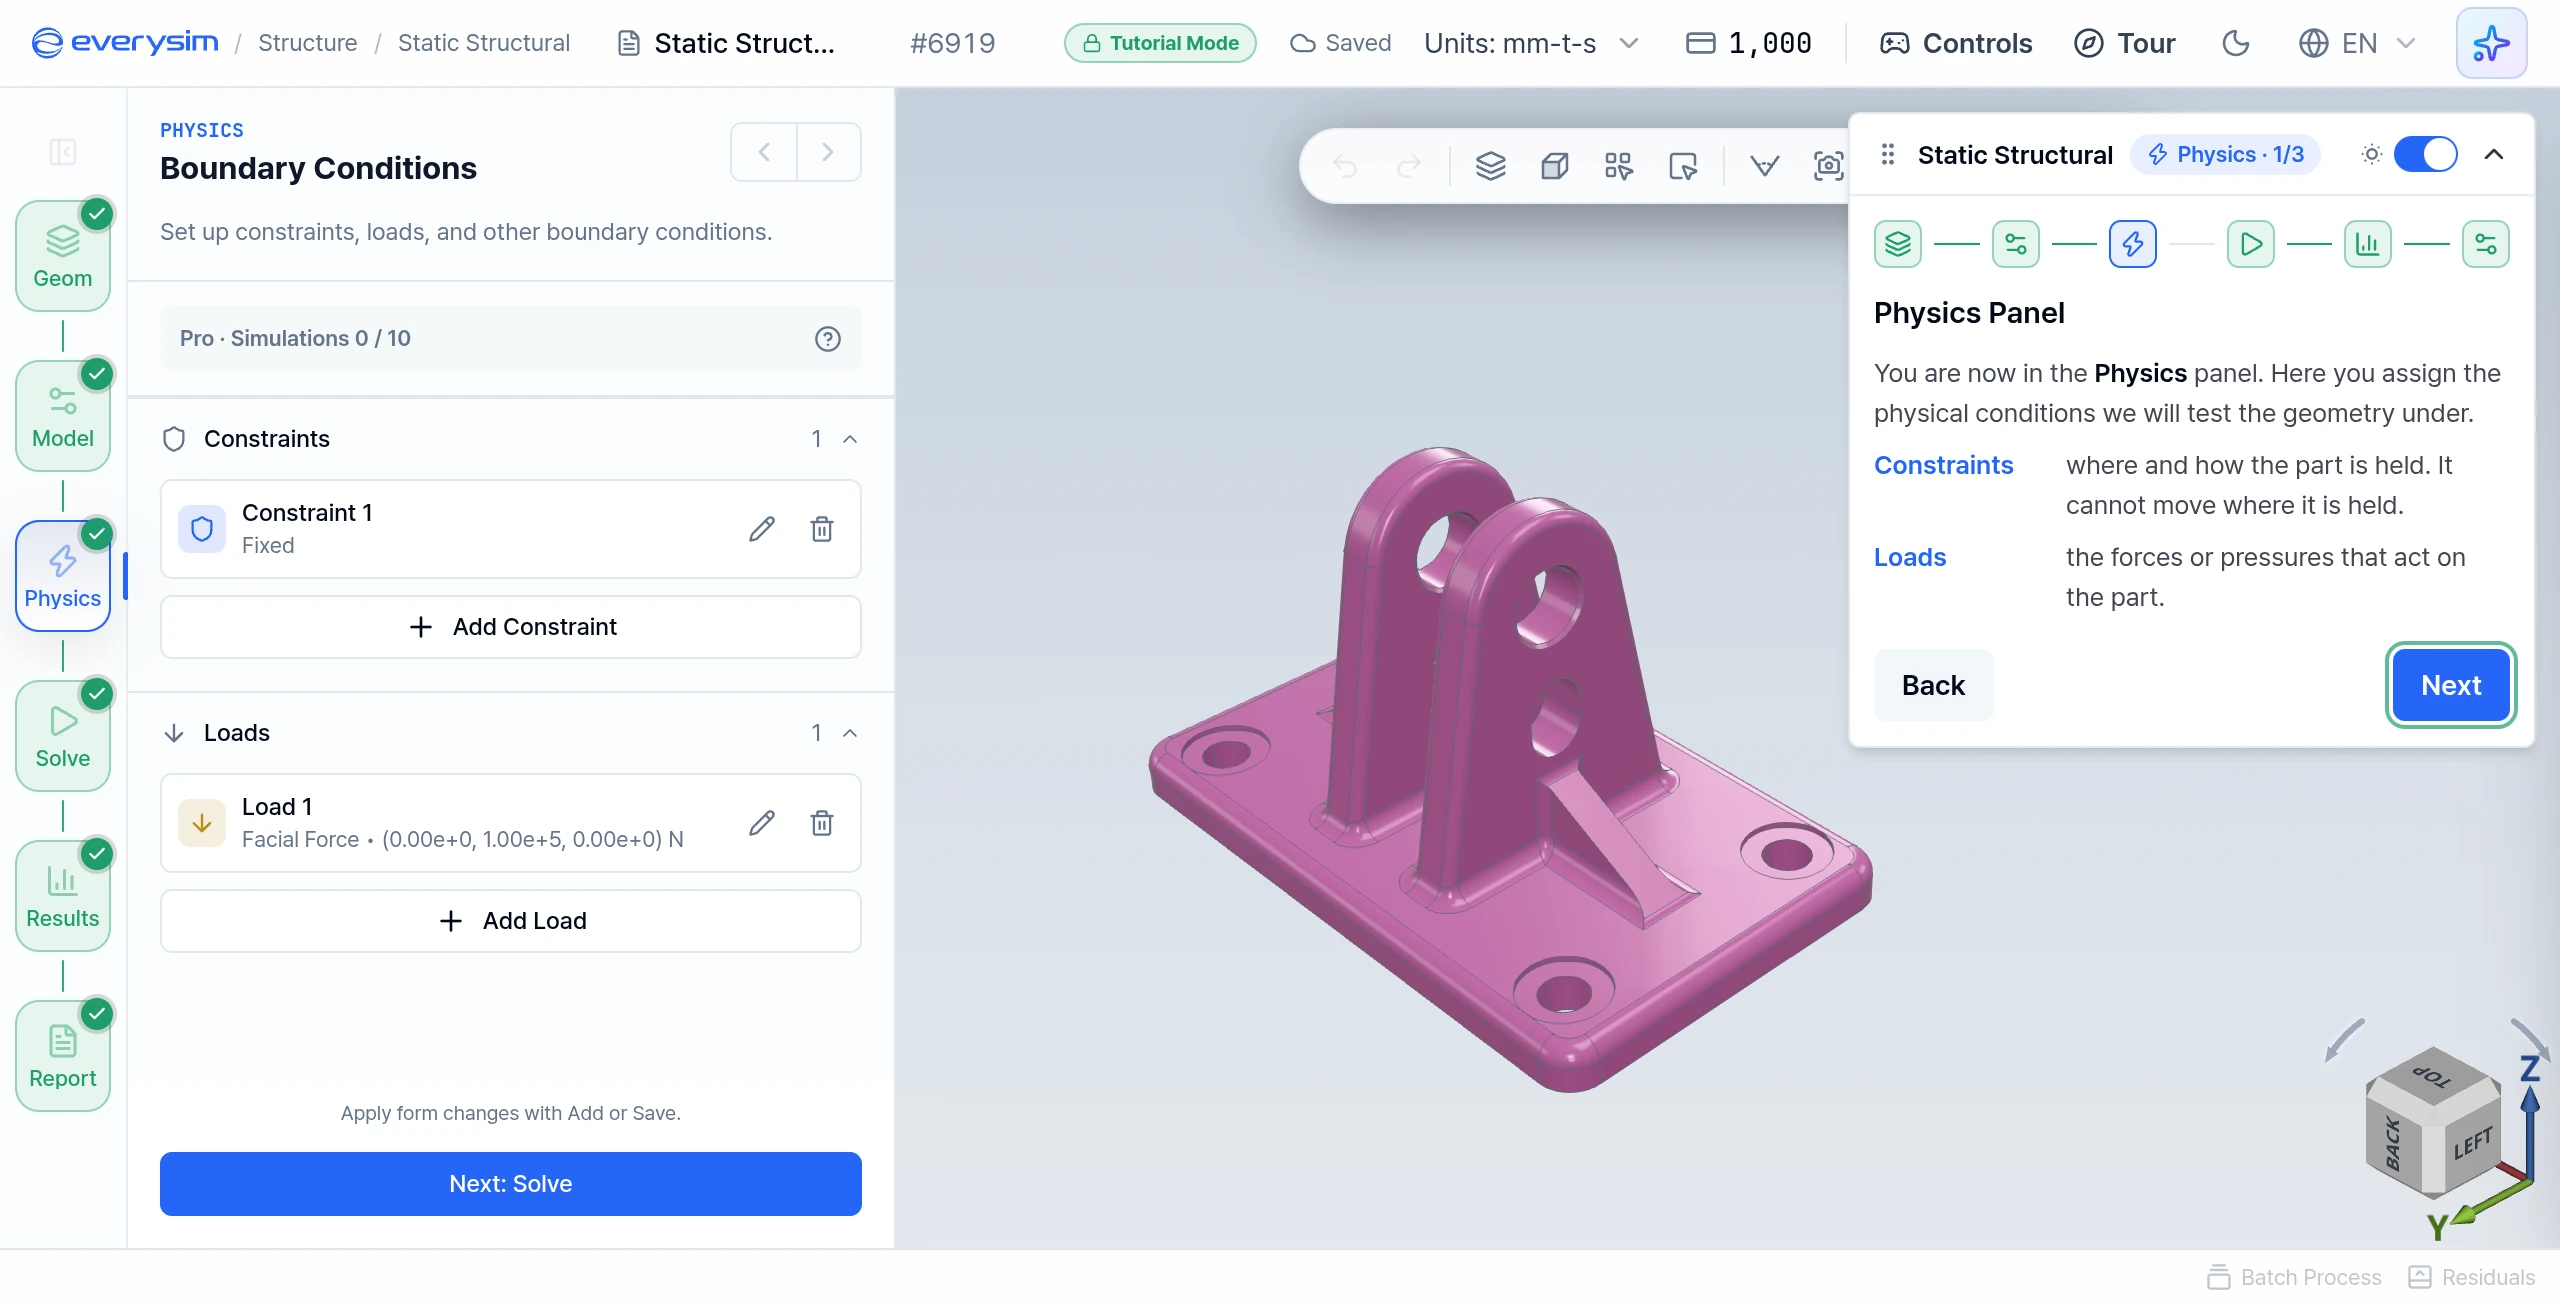
Here you assign the physical conditions. This page has no task.
- Constraints: where and how the part is held. It cannot move where it is held.
- Loads: the forces or pressures that act on the part.
4. Constraints
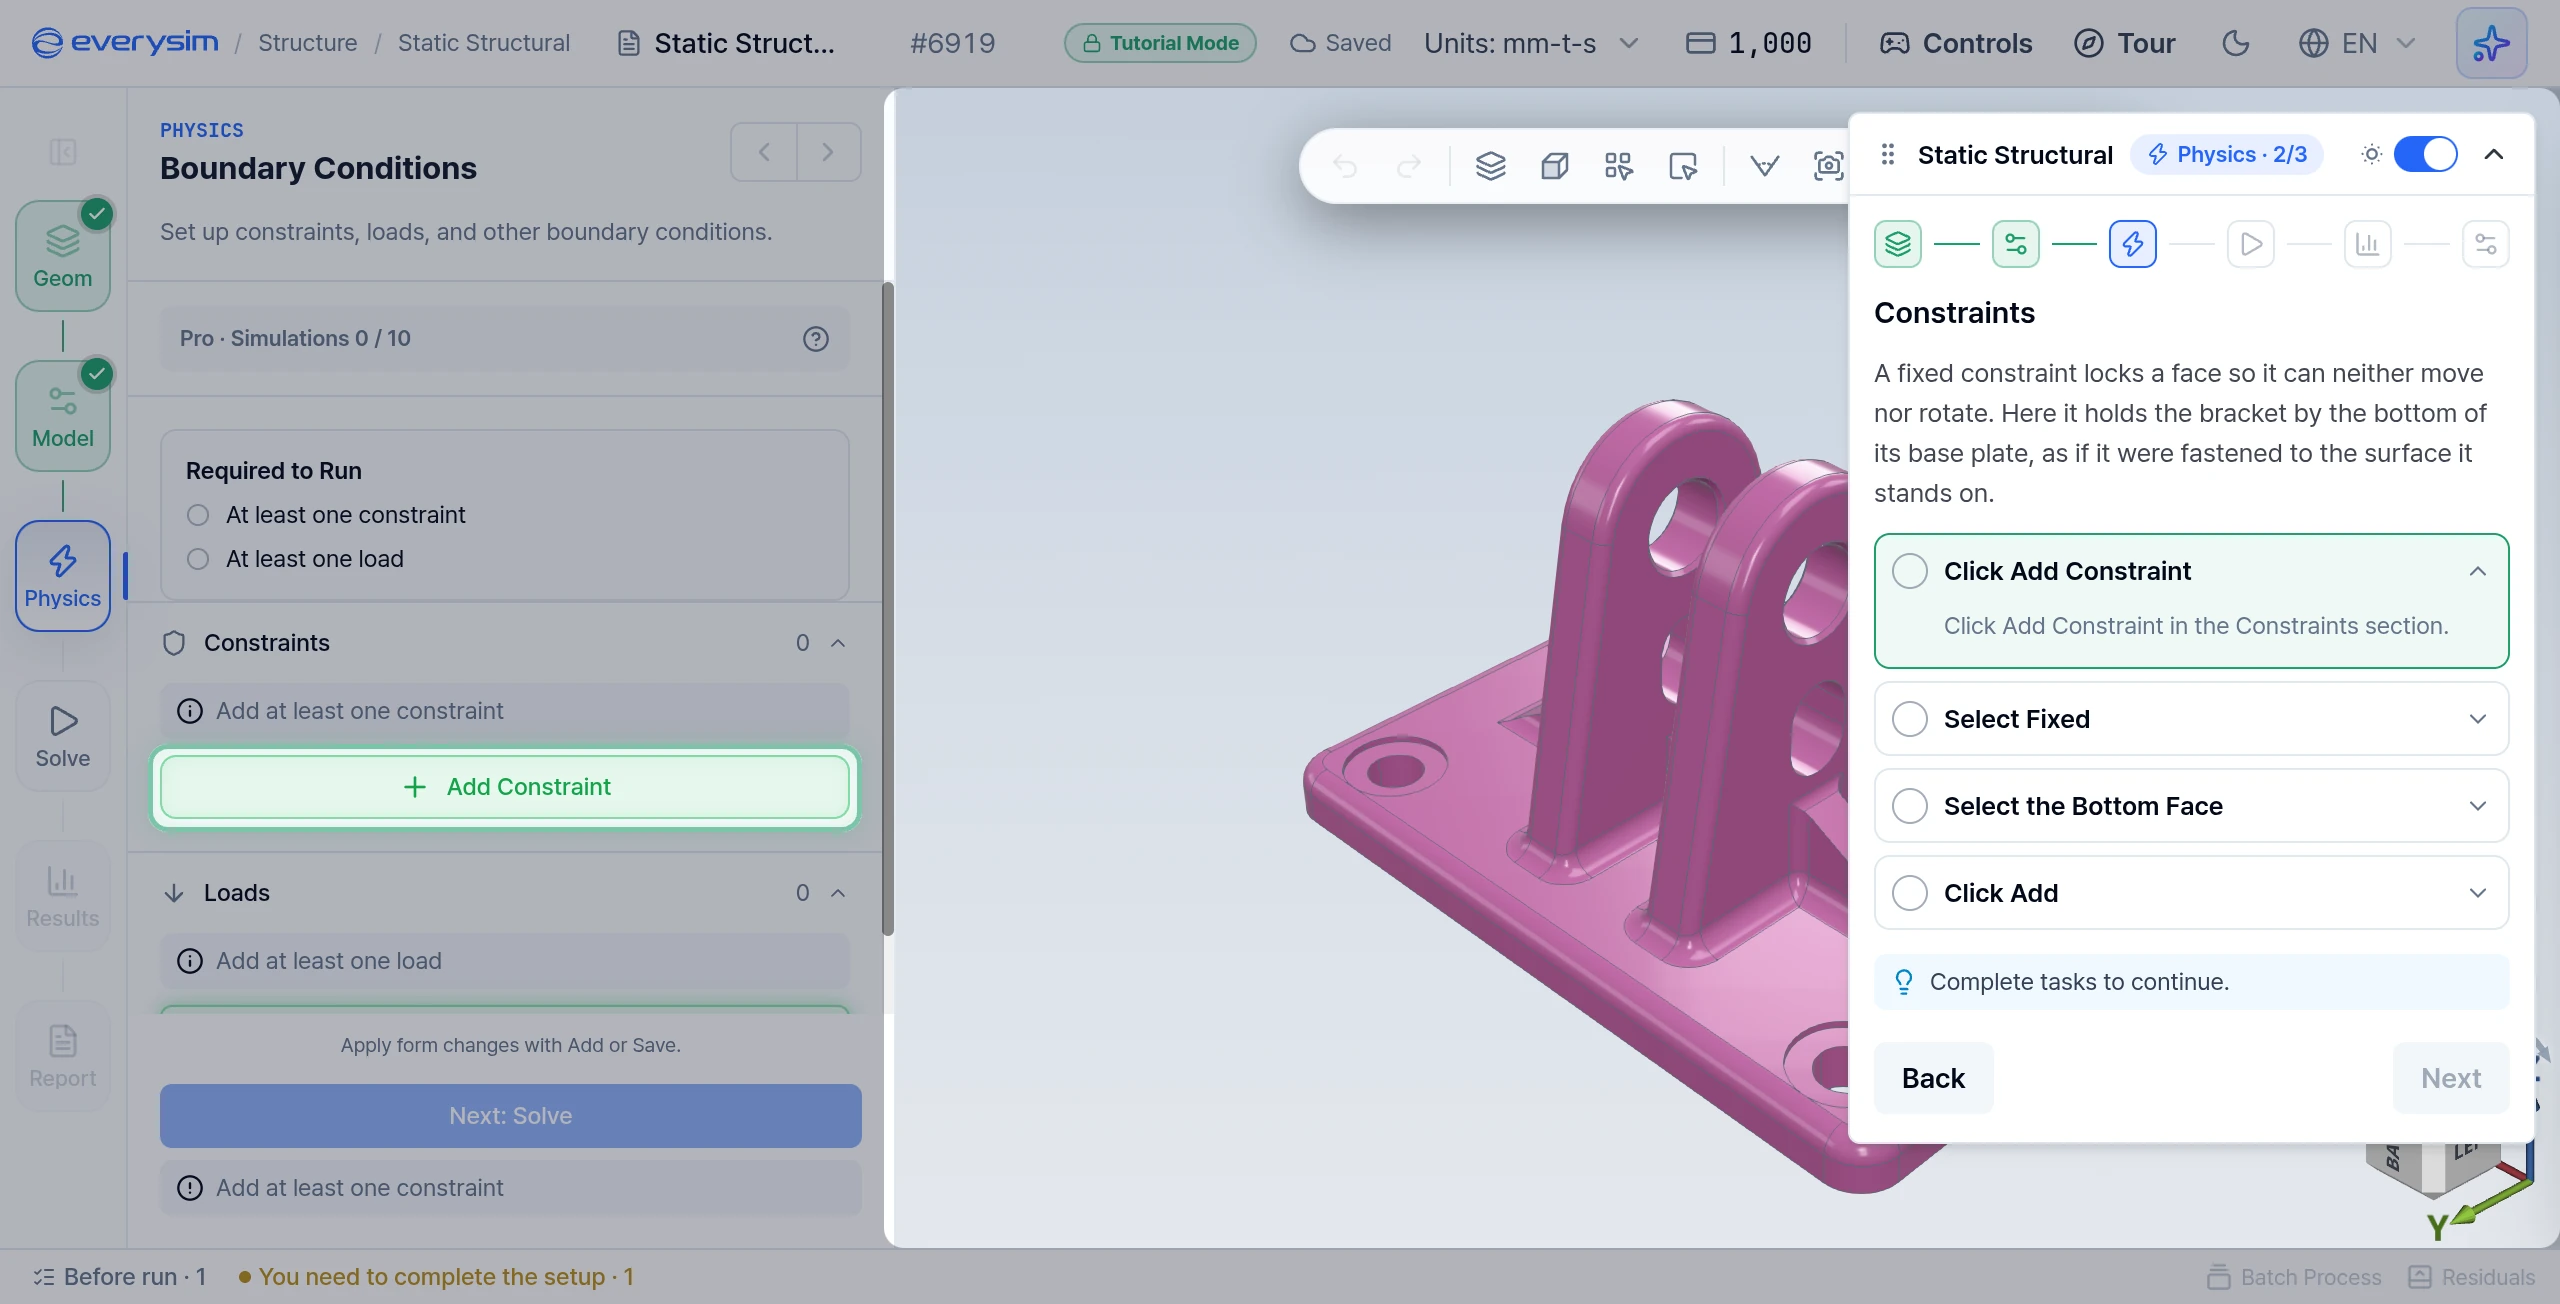
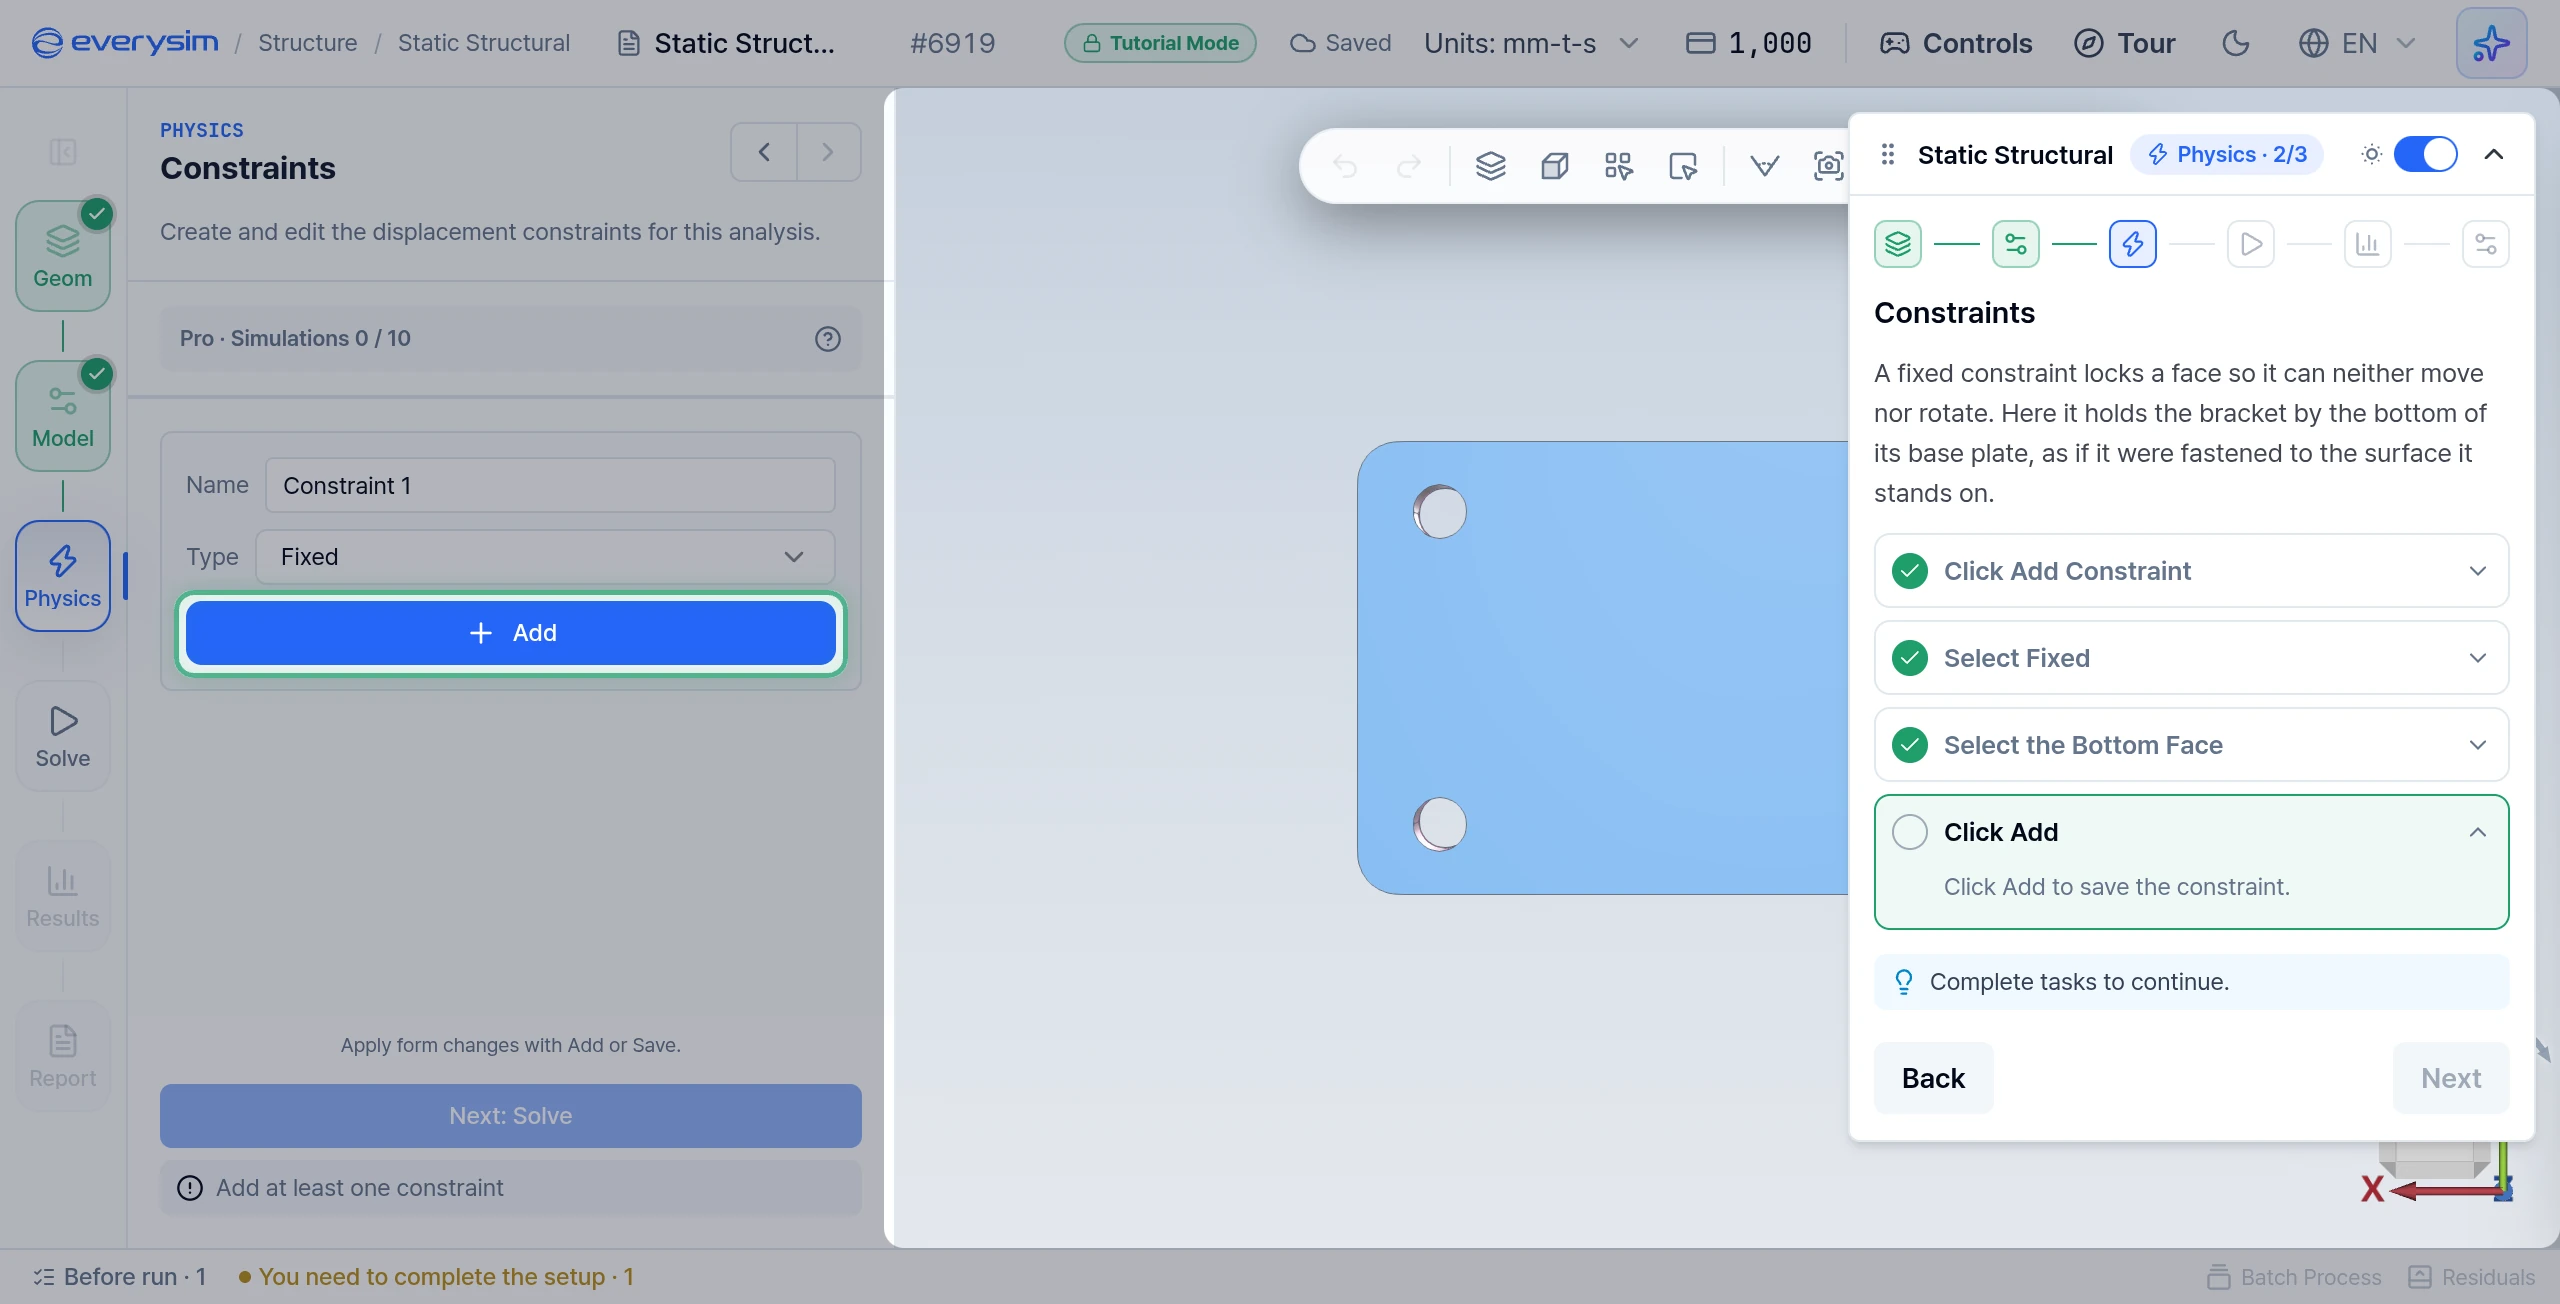
A fixed constraint locks a face so it can neither move nor rotate. Here it holds the bracket by the bottom of its base plate, as if it were fastened to the surface it stands on.
- Click Add Constraint in the Constraints section.
- Select Fixed: click Fixed under Type.
- Select the Bottom Face: the view turns to look at the bracket from below. Click the flat bottom face of the base plate. The task ticks only on this face.
- Click Add to save the constraint.
5. Load
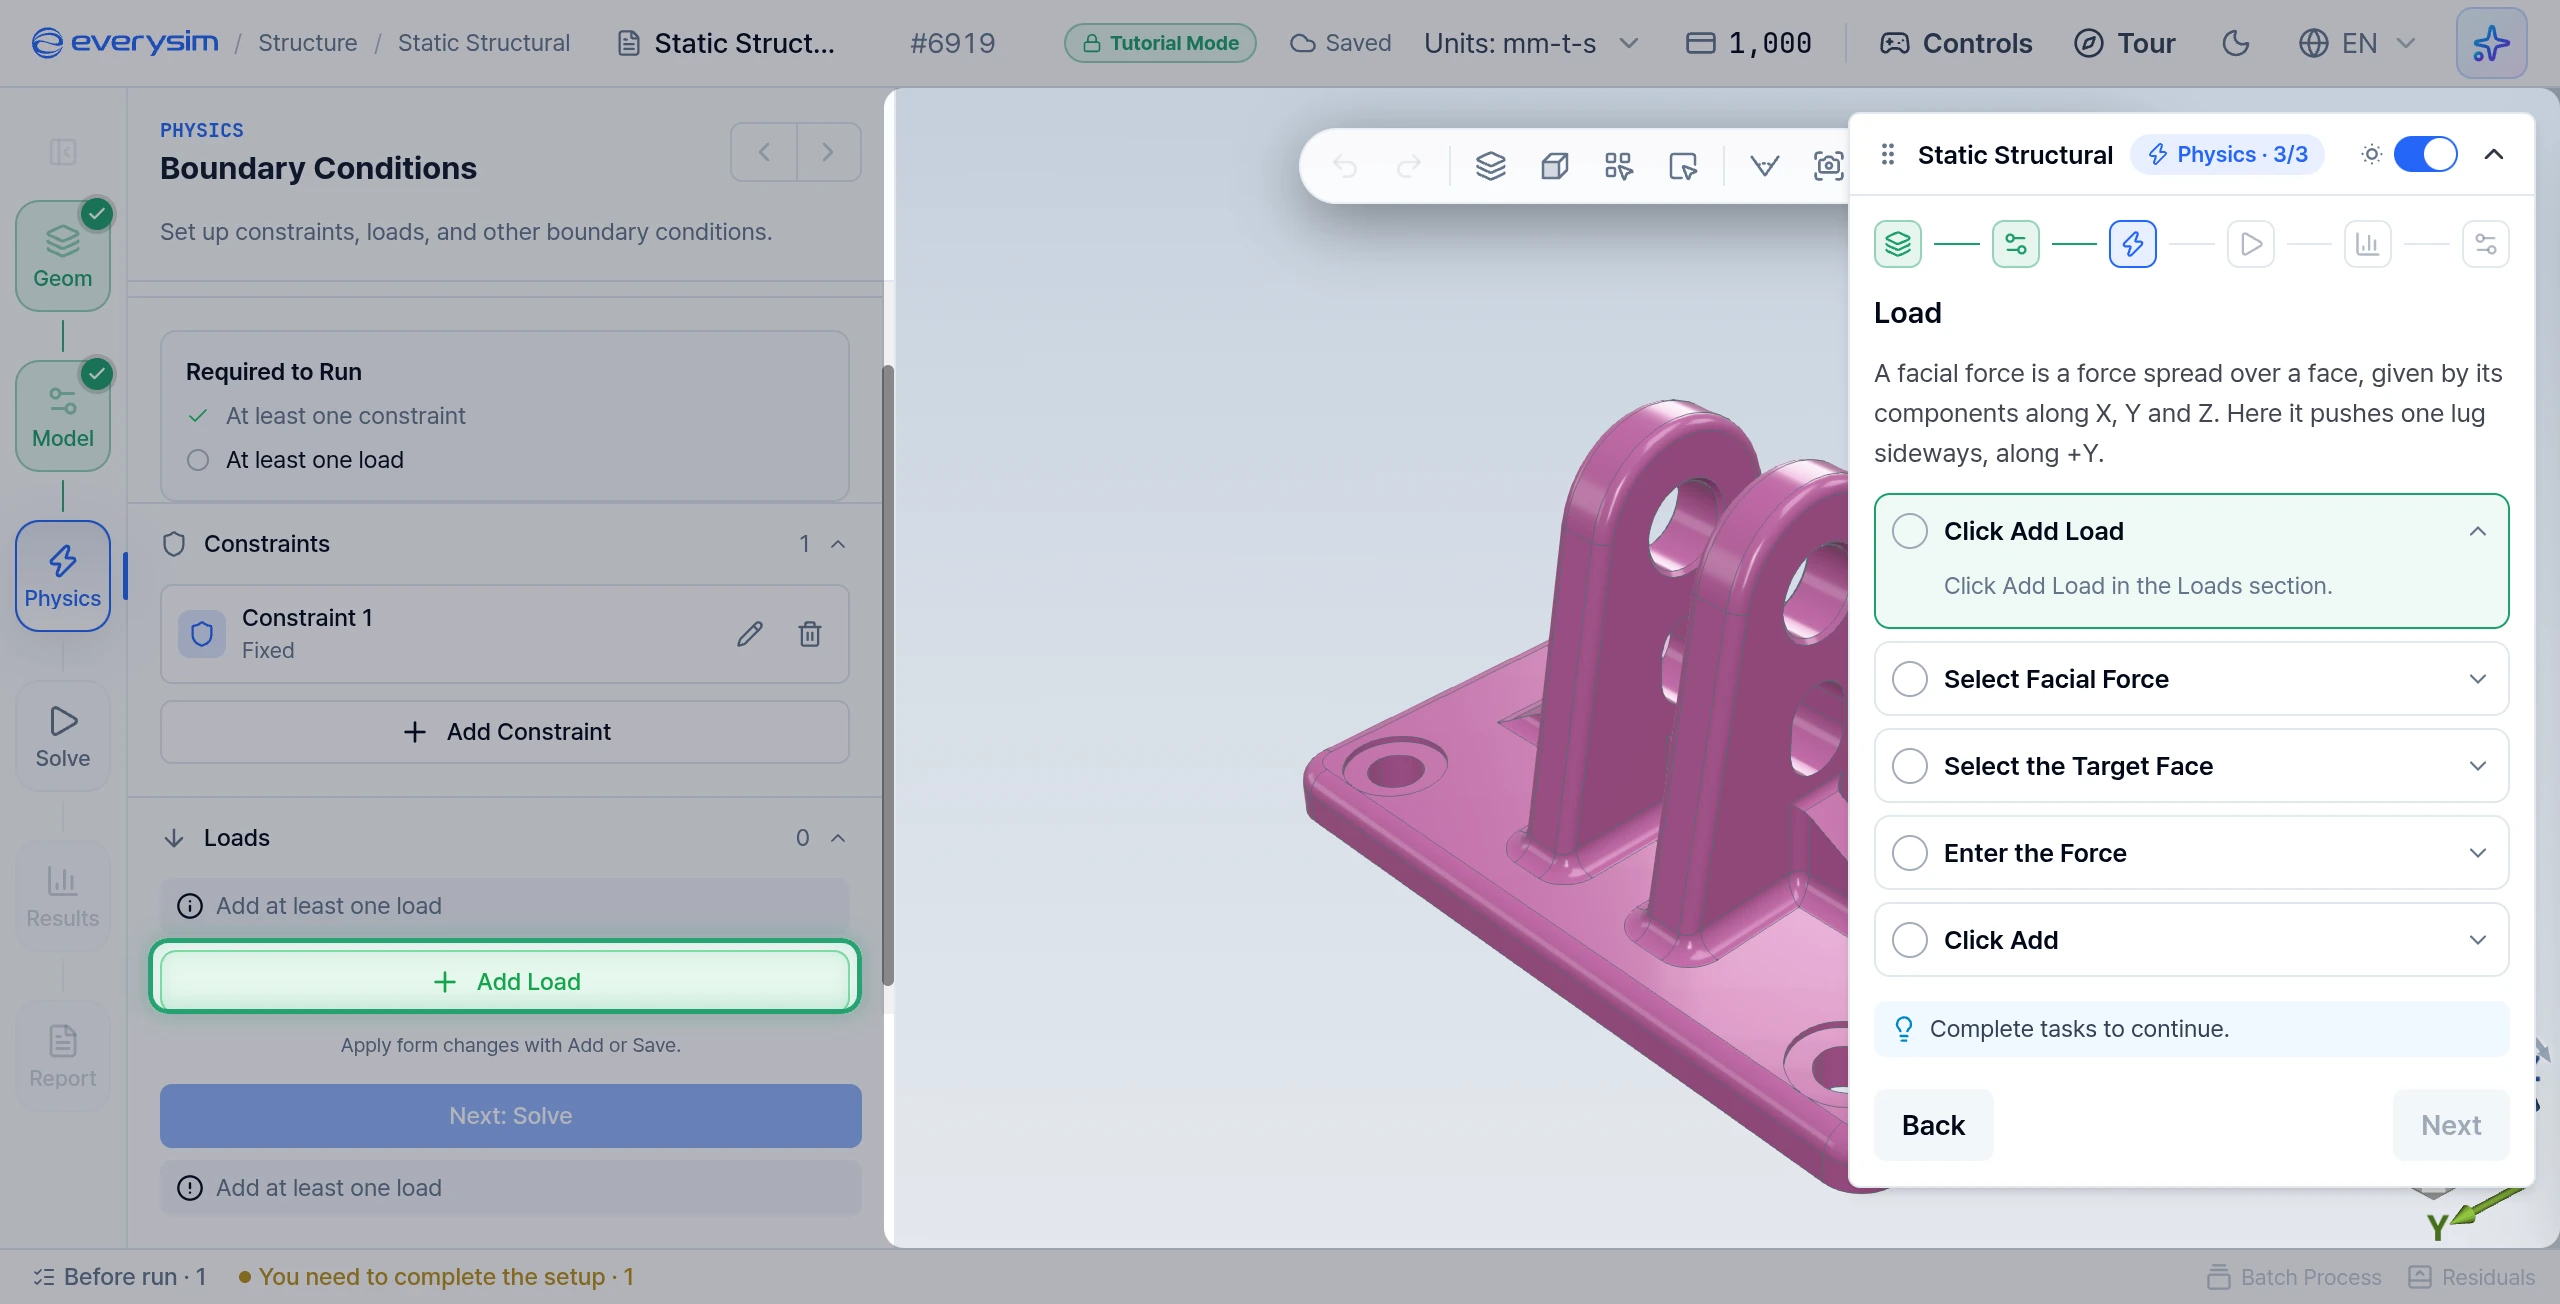
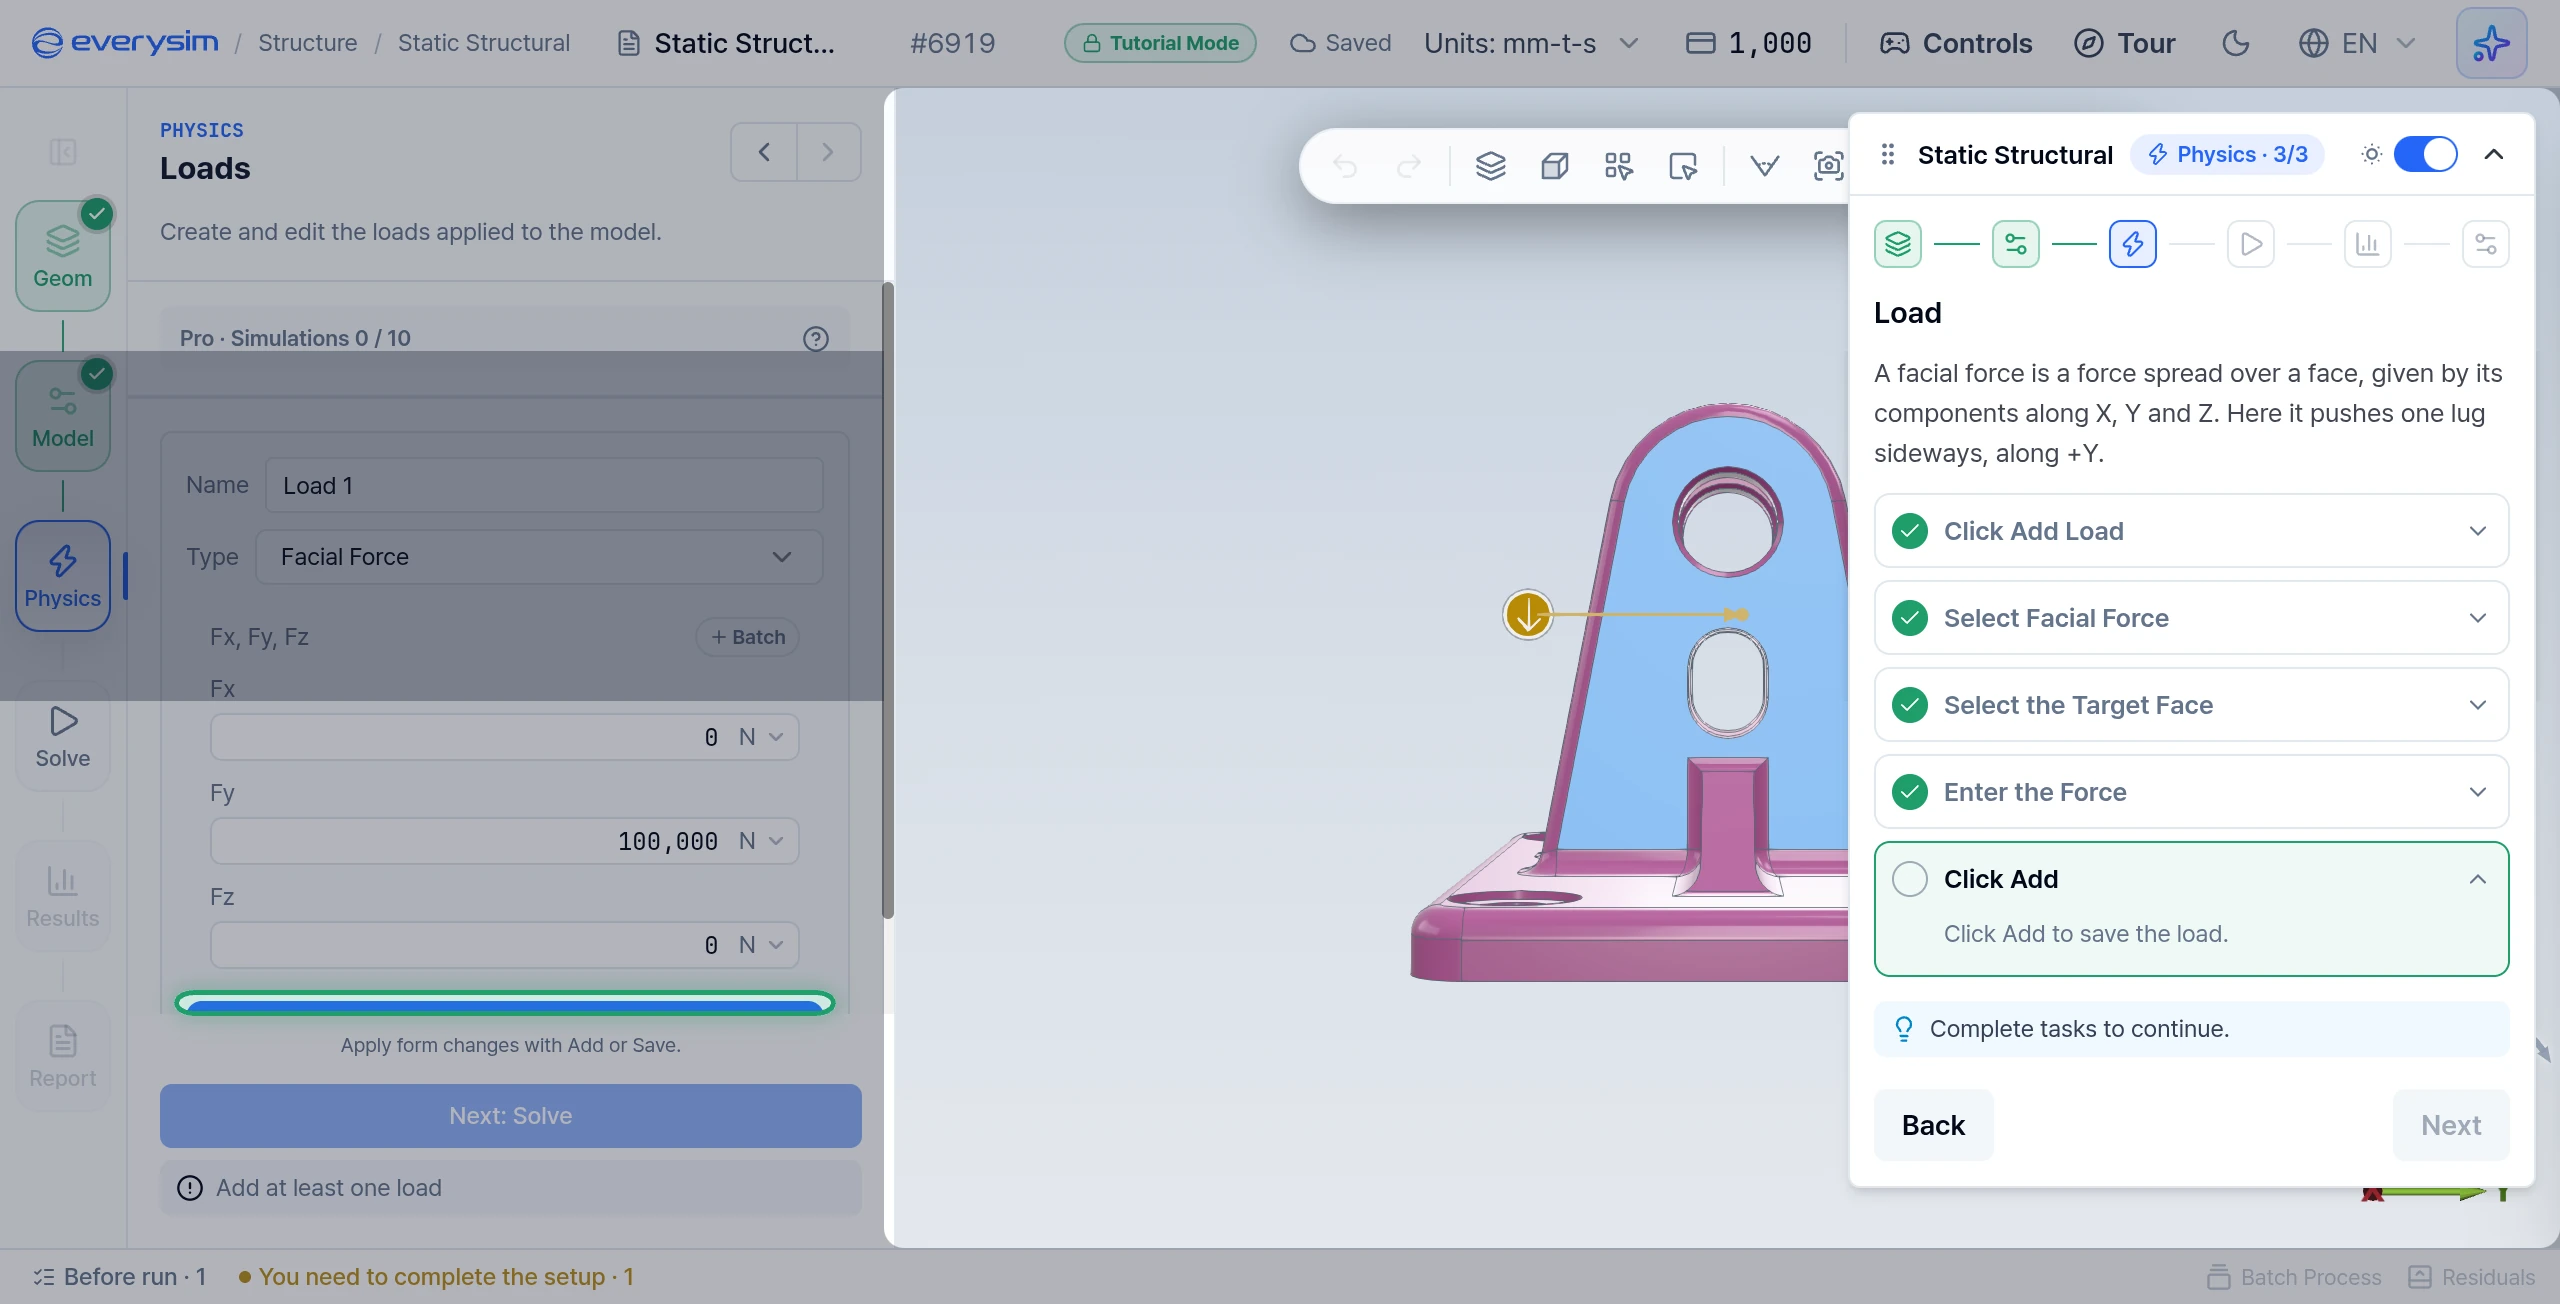
A facial force is a force spread over a face, given by its components along X, Y and Z. Here it pushes one lug sideways, along +Y.
- Click Add Load in the Loads section.
- Select Facial Force: click Facial Force under Type.
- Select the Target Face: the view turns to face the outer side of the lug to push. Click its flat face.
- Enter the Force: type
100000in Fy and press Enter. The field is in N. Fx and Fz stay0. - Click Add to save the load.
6. Solve Settings
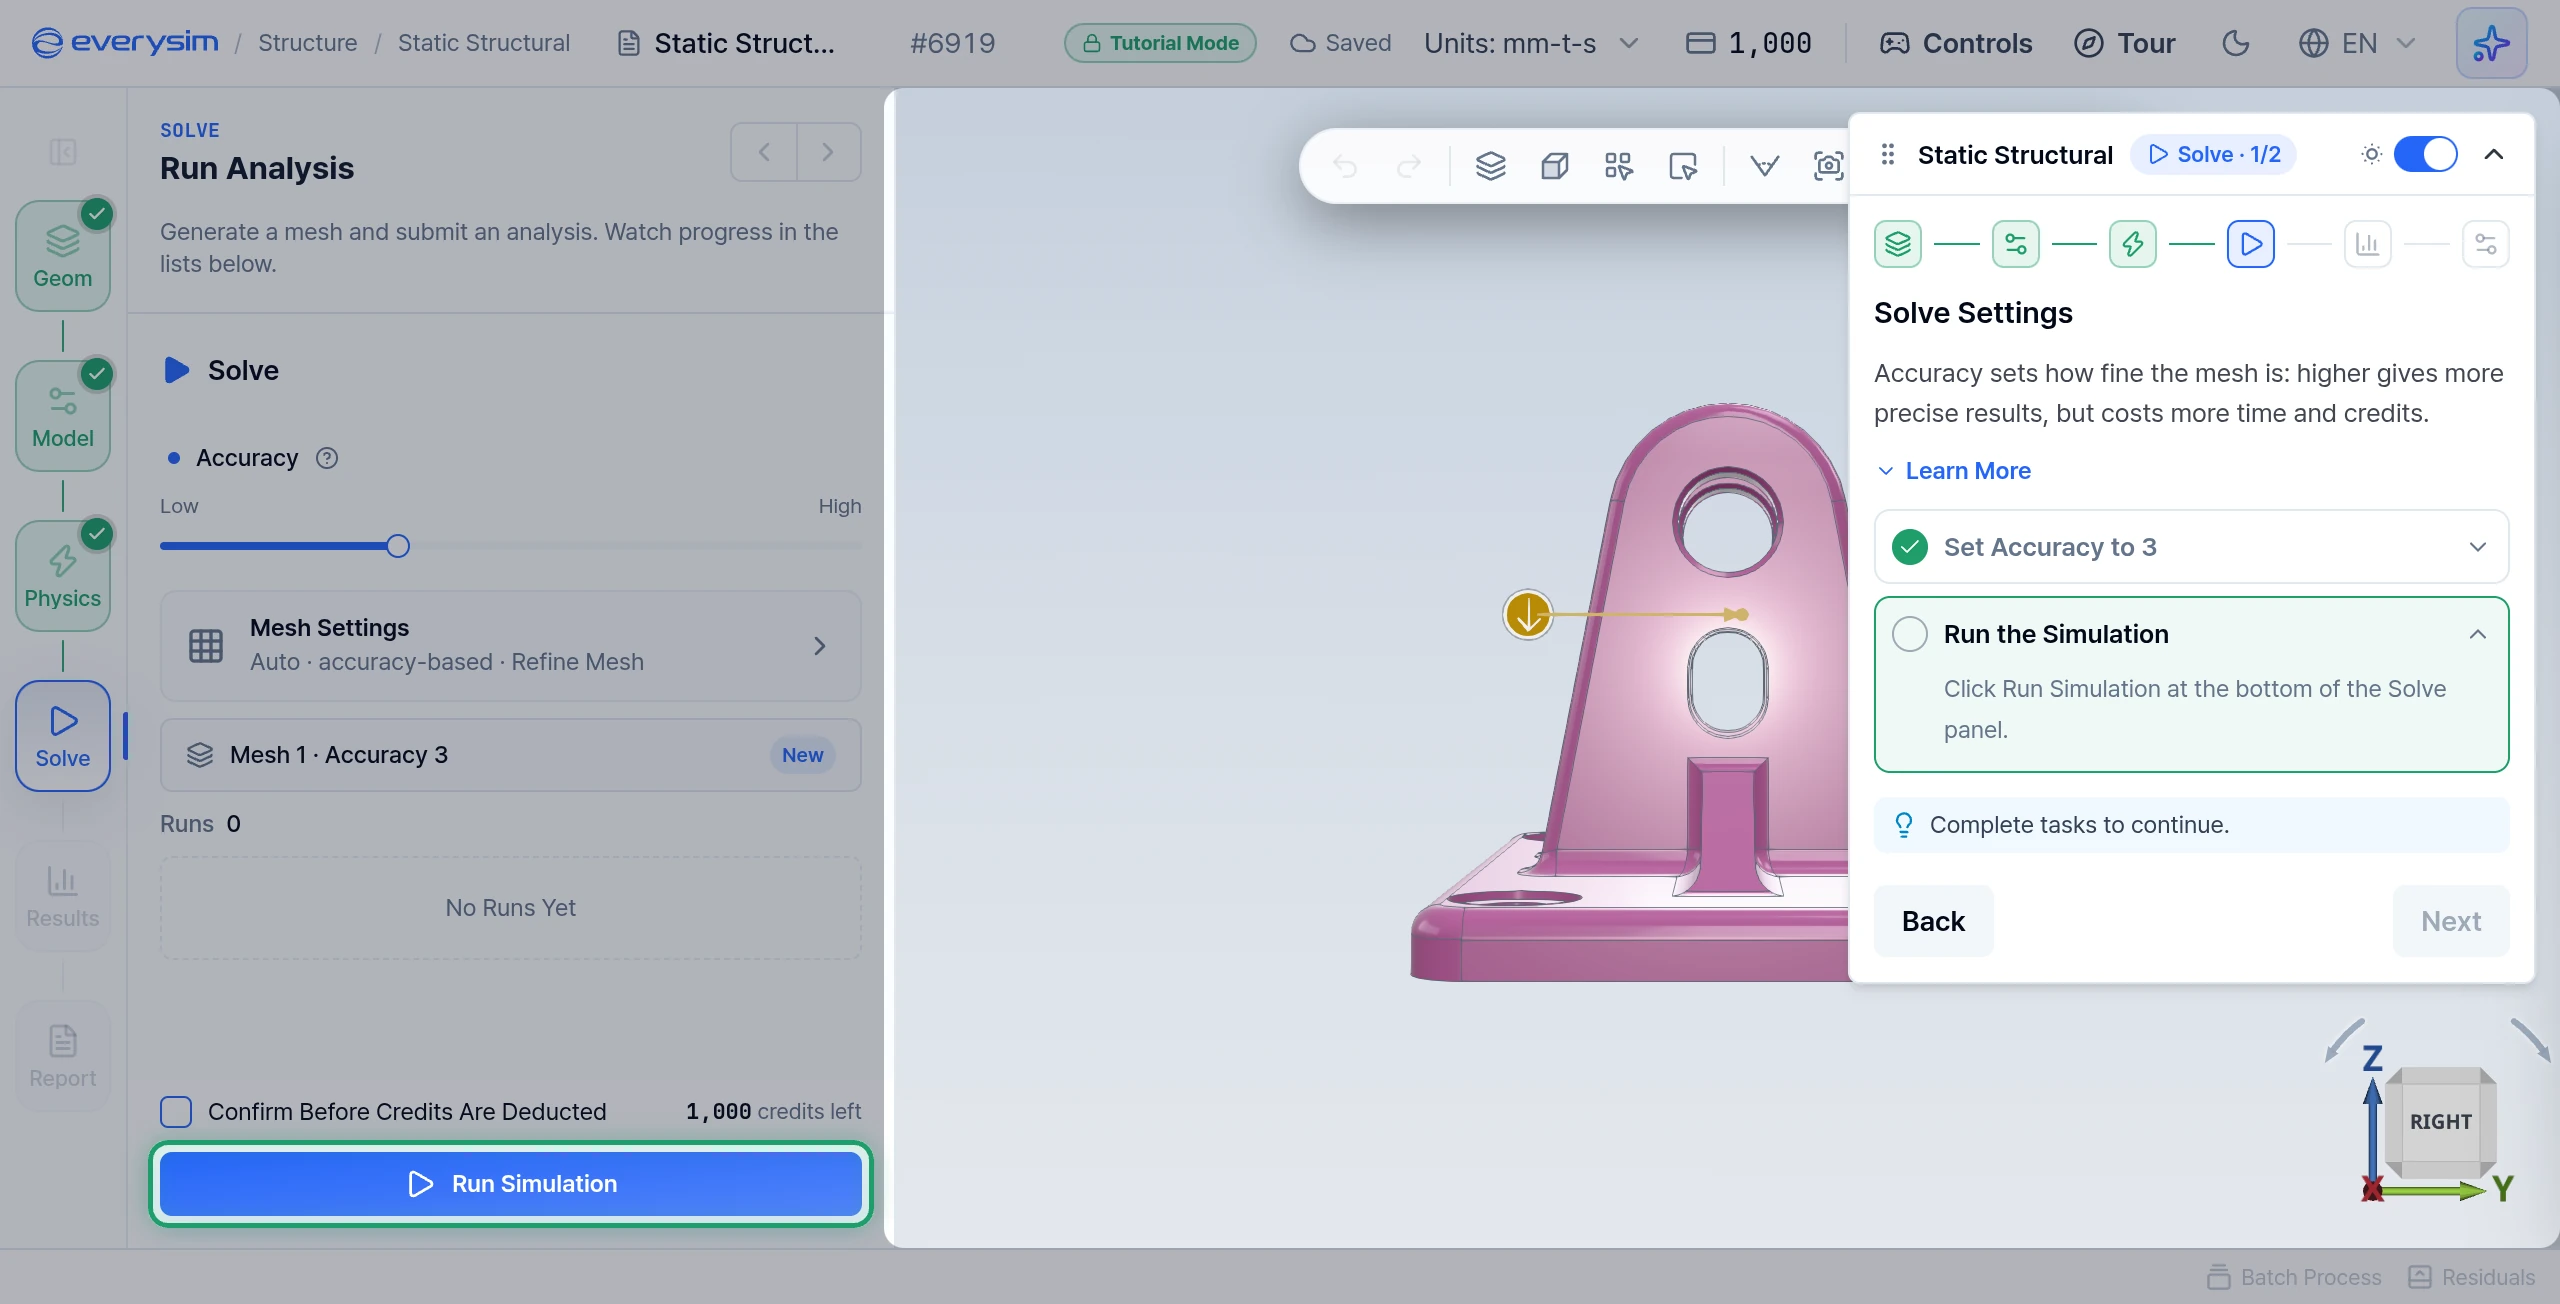
To calculate the stress, the geometry is divided into many small elements called a mesh. Accuracy sets how fine it is: higher gives more precise results, but costs more time and credits.
- Set Accuracy to 3: move the slider to
3. The project starts on2, so the slider has to move. - Run the Simulation: click Run Simulation at the bottom of the Solve panel.
A tutorial's Run does not submit a job and costs no credits. After about 3 seconds it opens a result computed in advance with these exact faces and this force. The simulation card can still show an amount such as −1 credits, but tutorial runs are not charged.
7. Simulation Progress
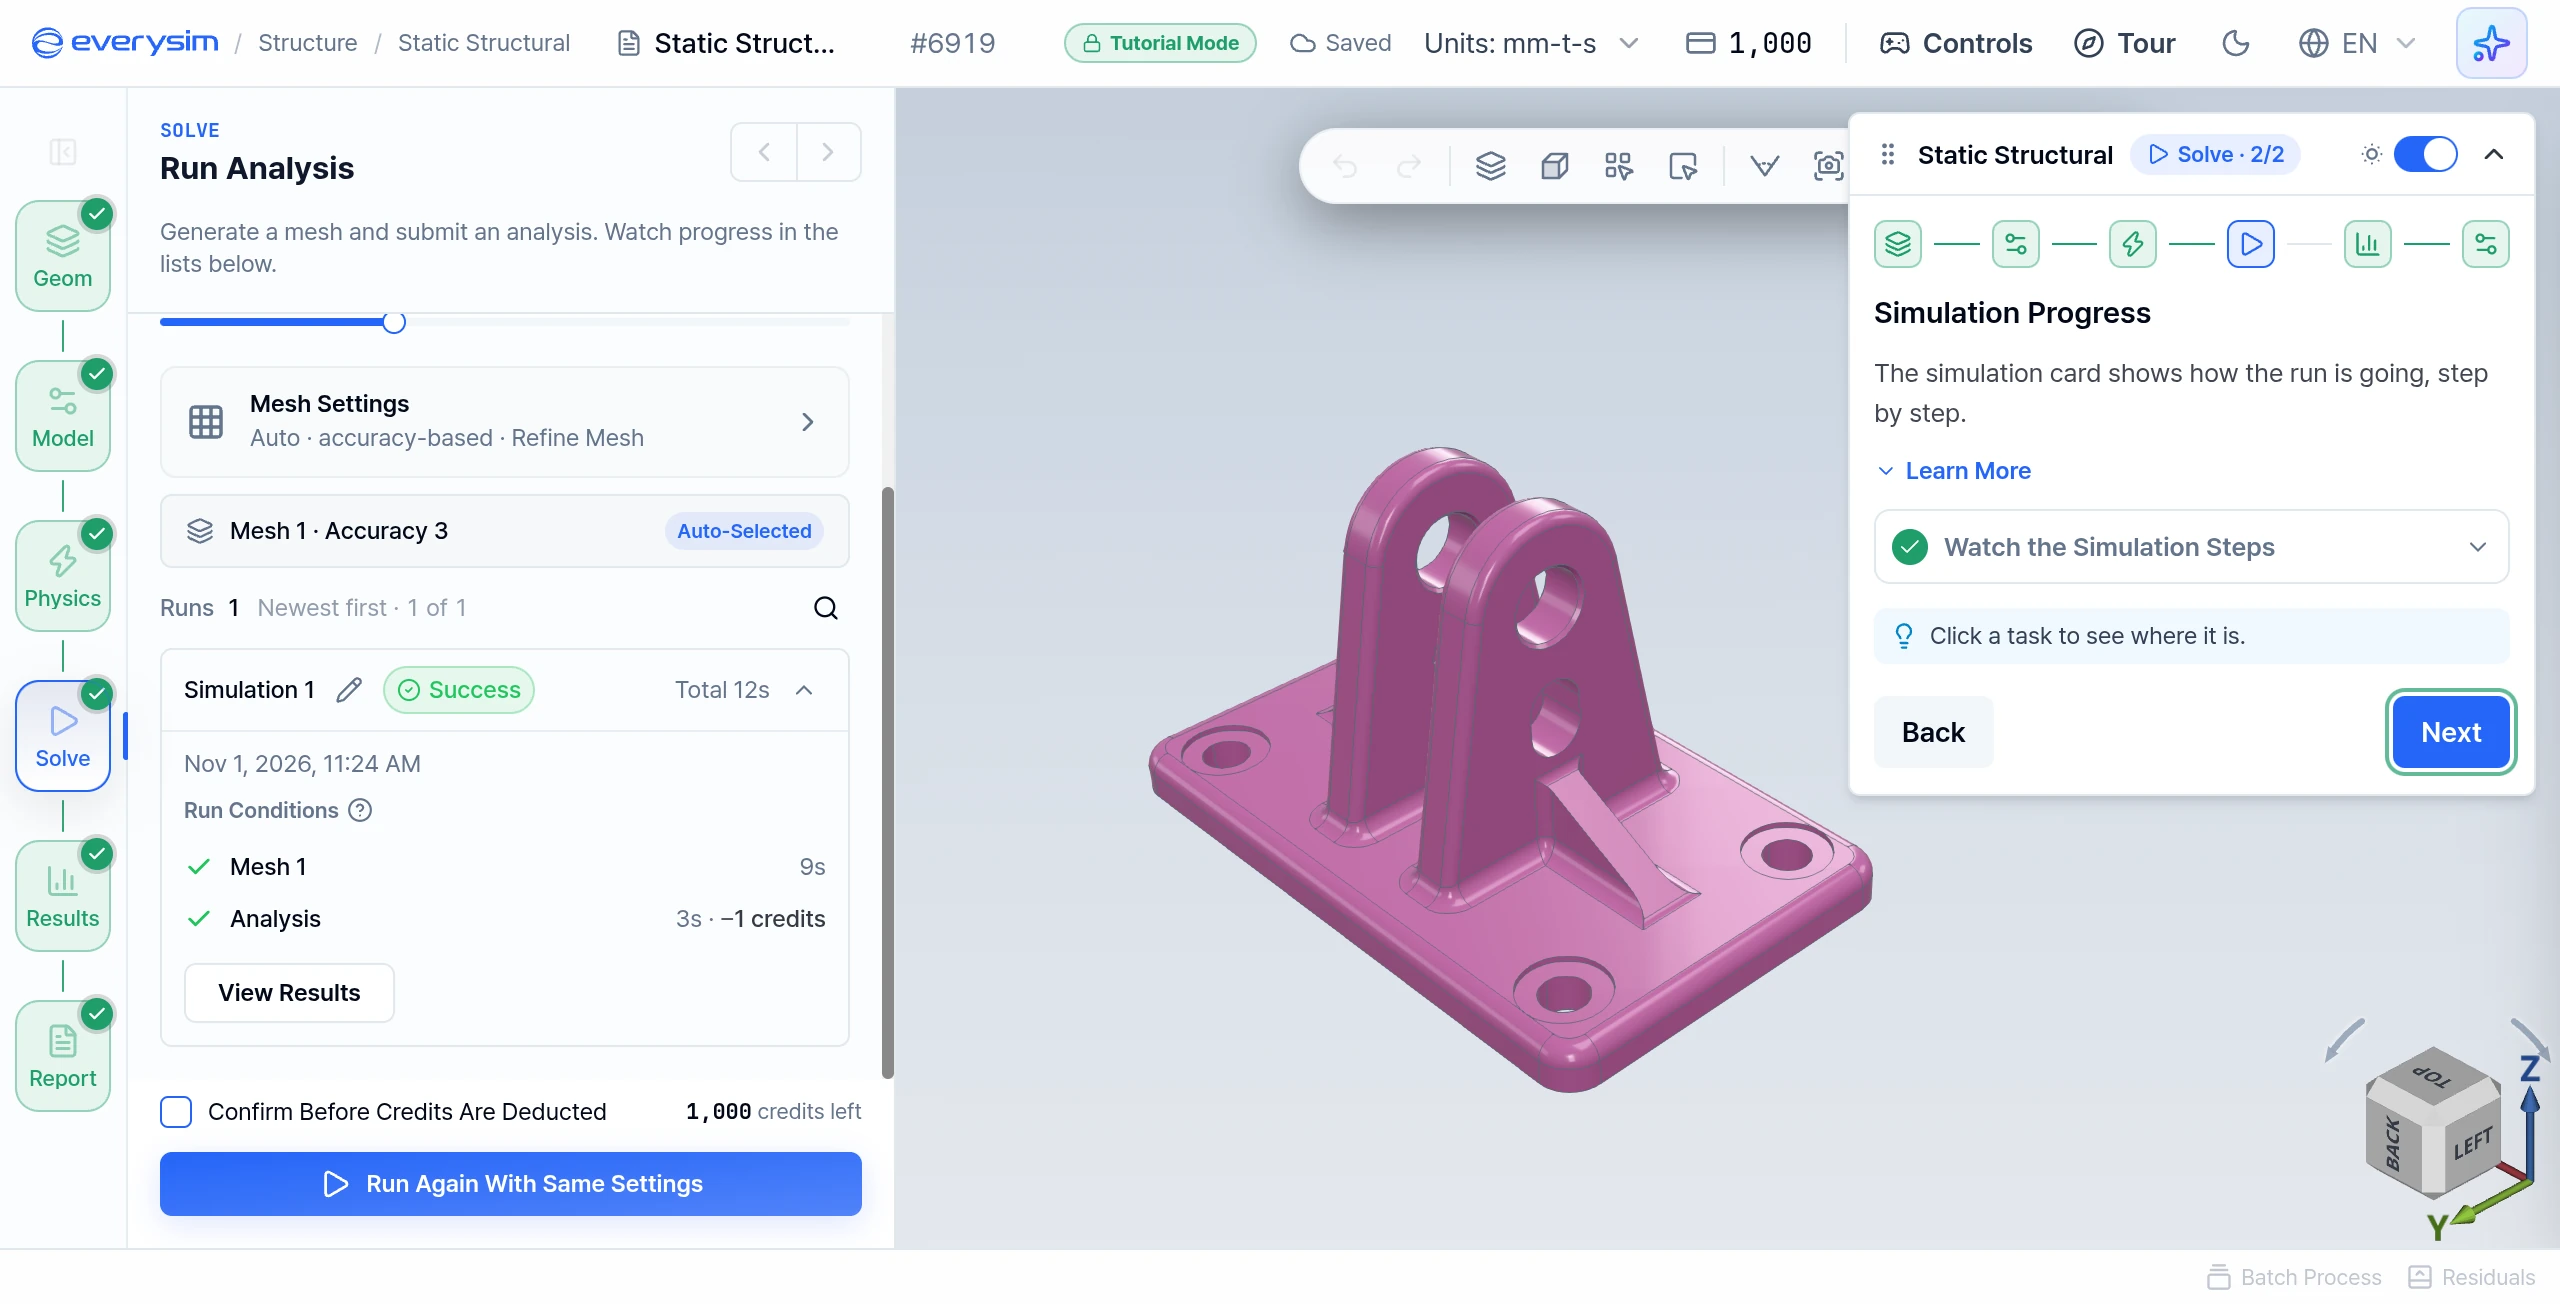
Watch the Simulation Steps: the simulation card lists the steps of a structural analysis: it reads the mesh, applies the material, the constraints and the loads, solves, and writes the results. Each step is ticked as it finishes. After Finalizing, the run changes to Success and the results open.
8. Your Results
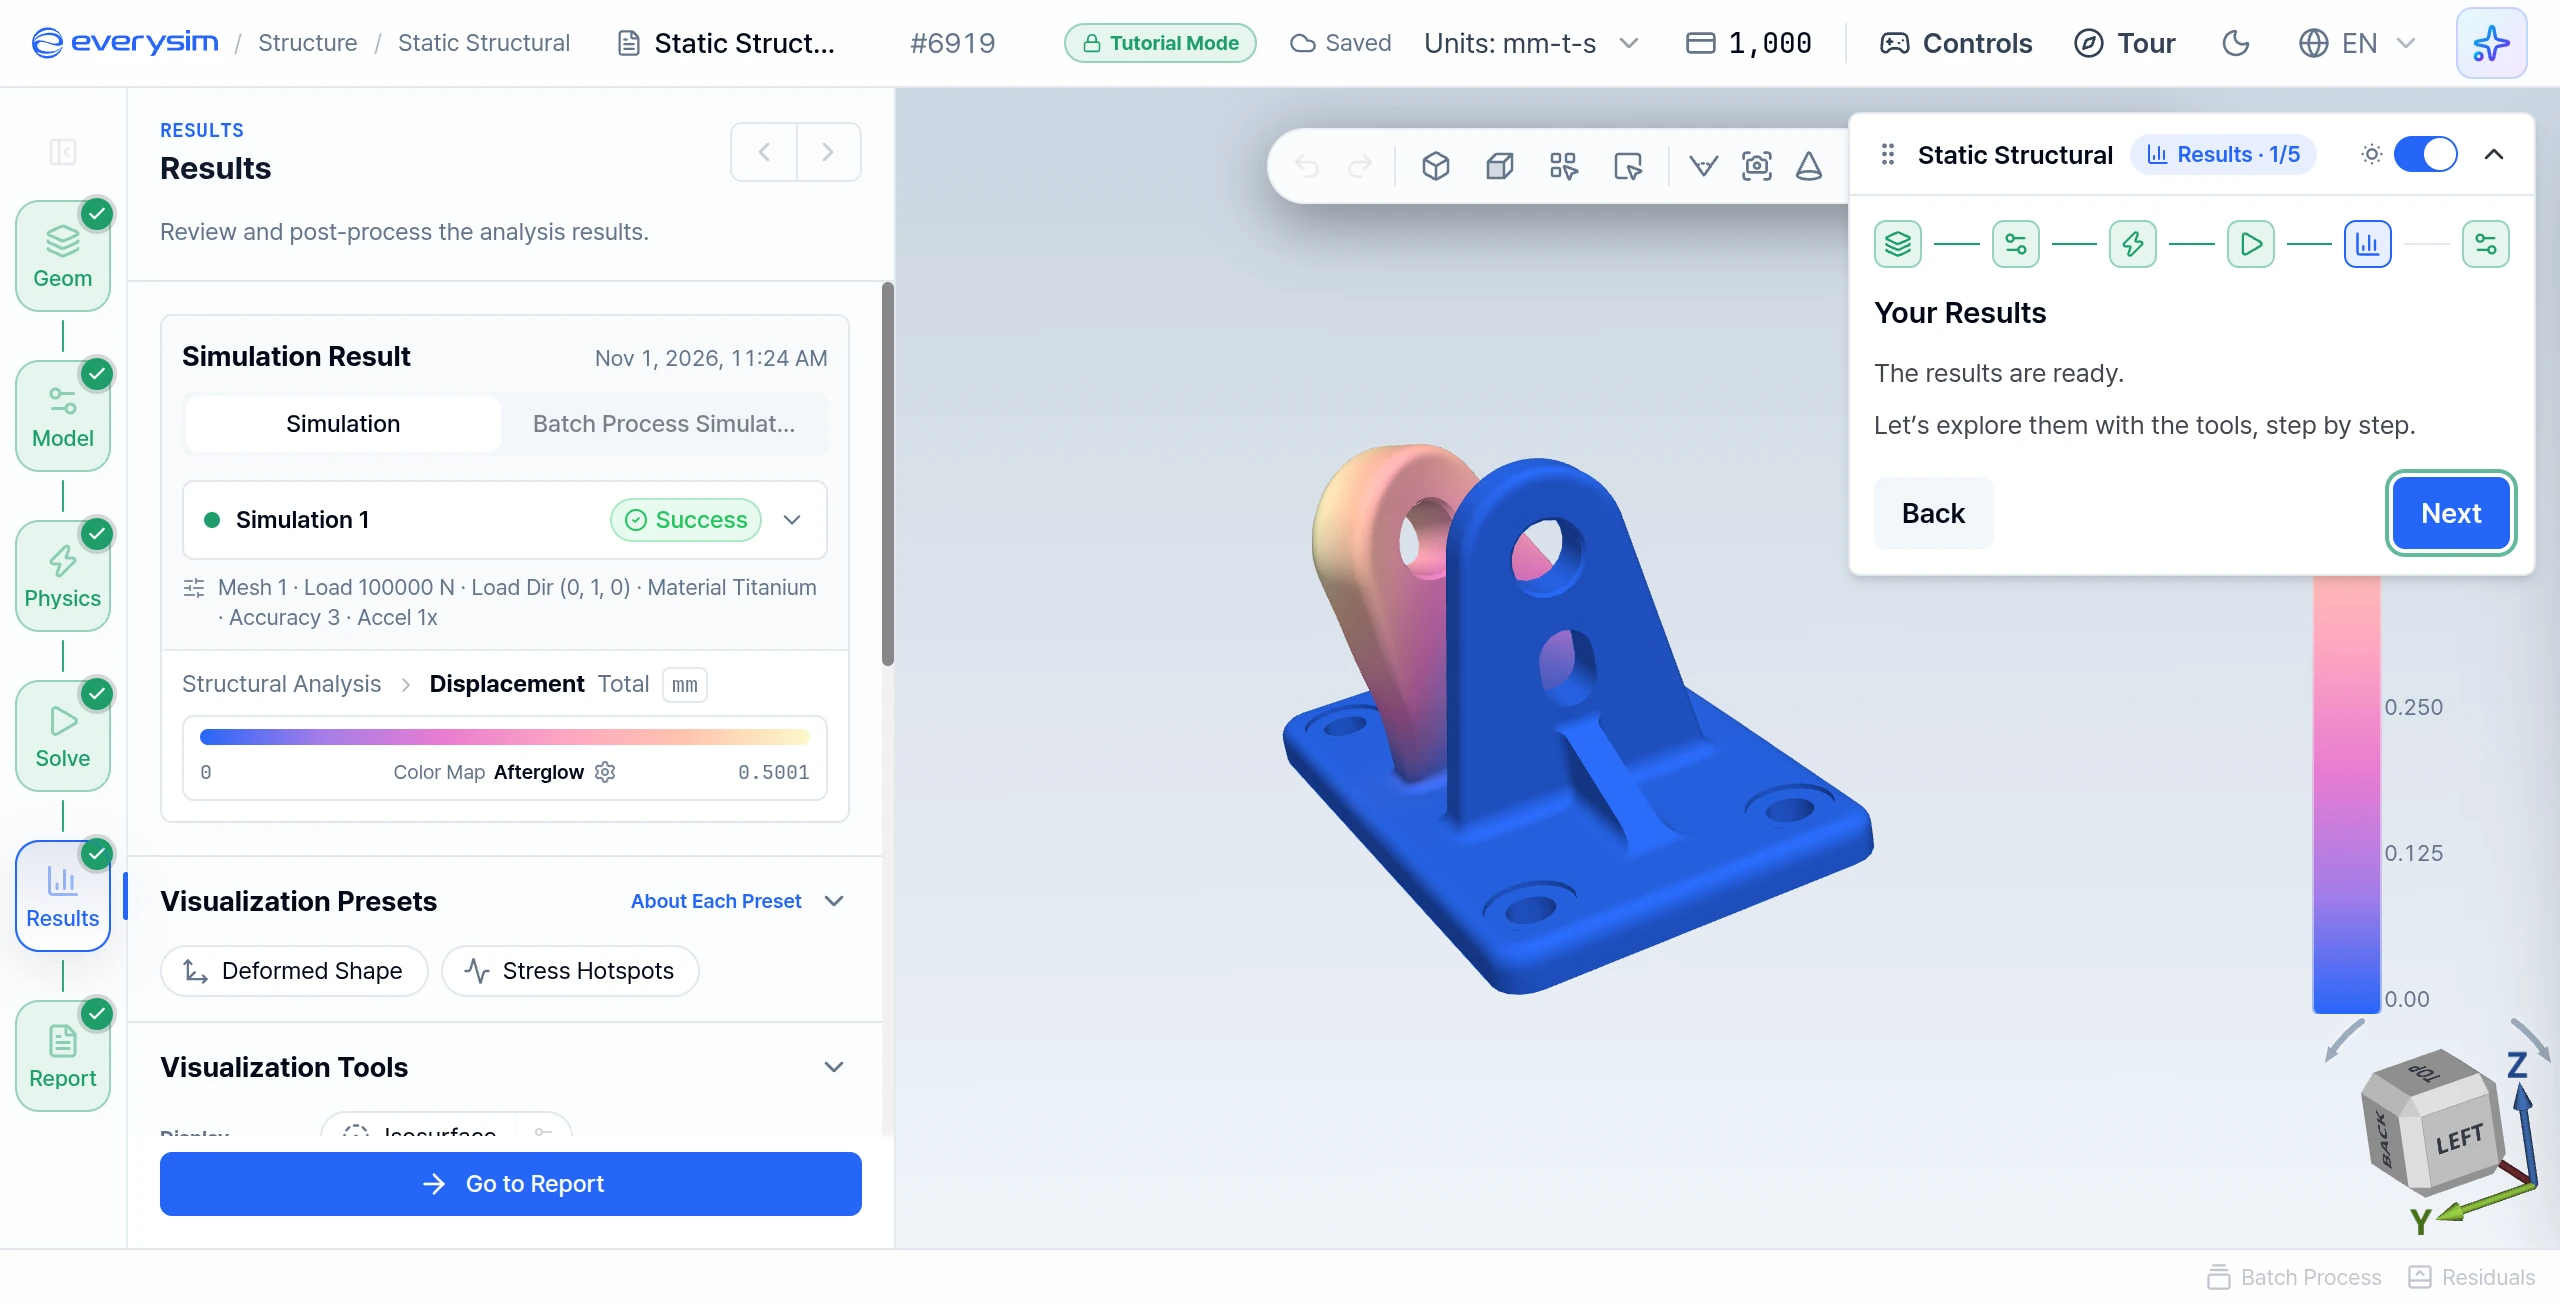
This page only announces the results. Press Next to explore them.
9. Result Fields
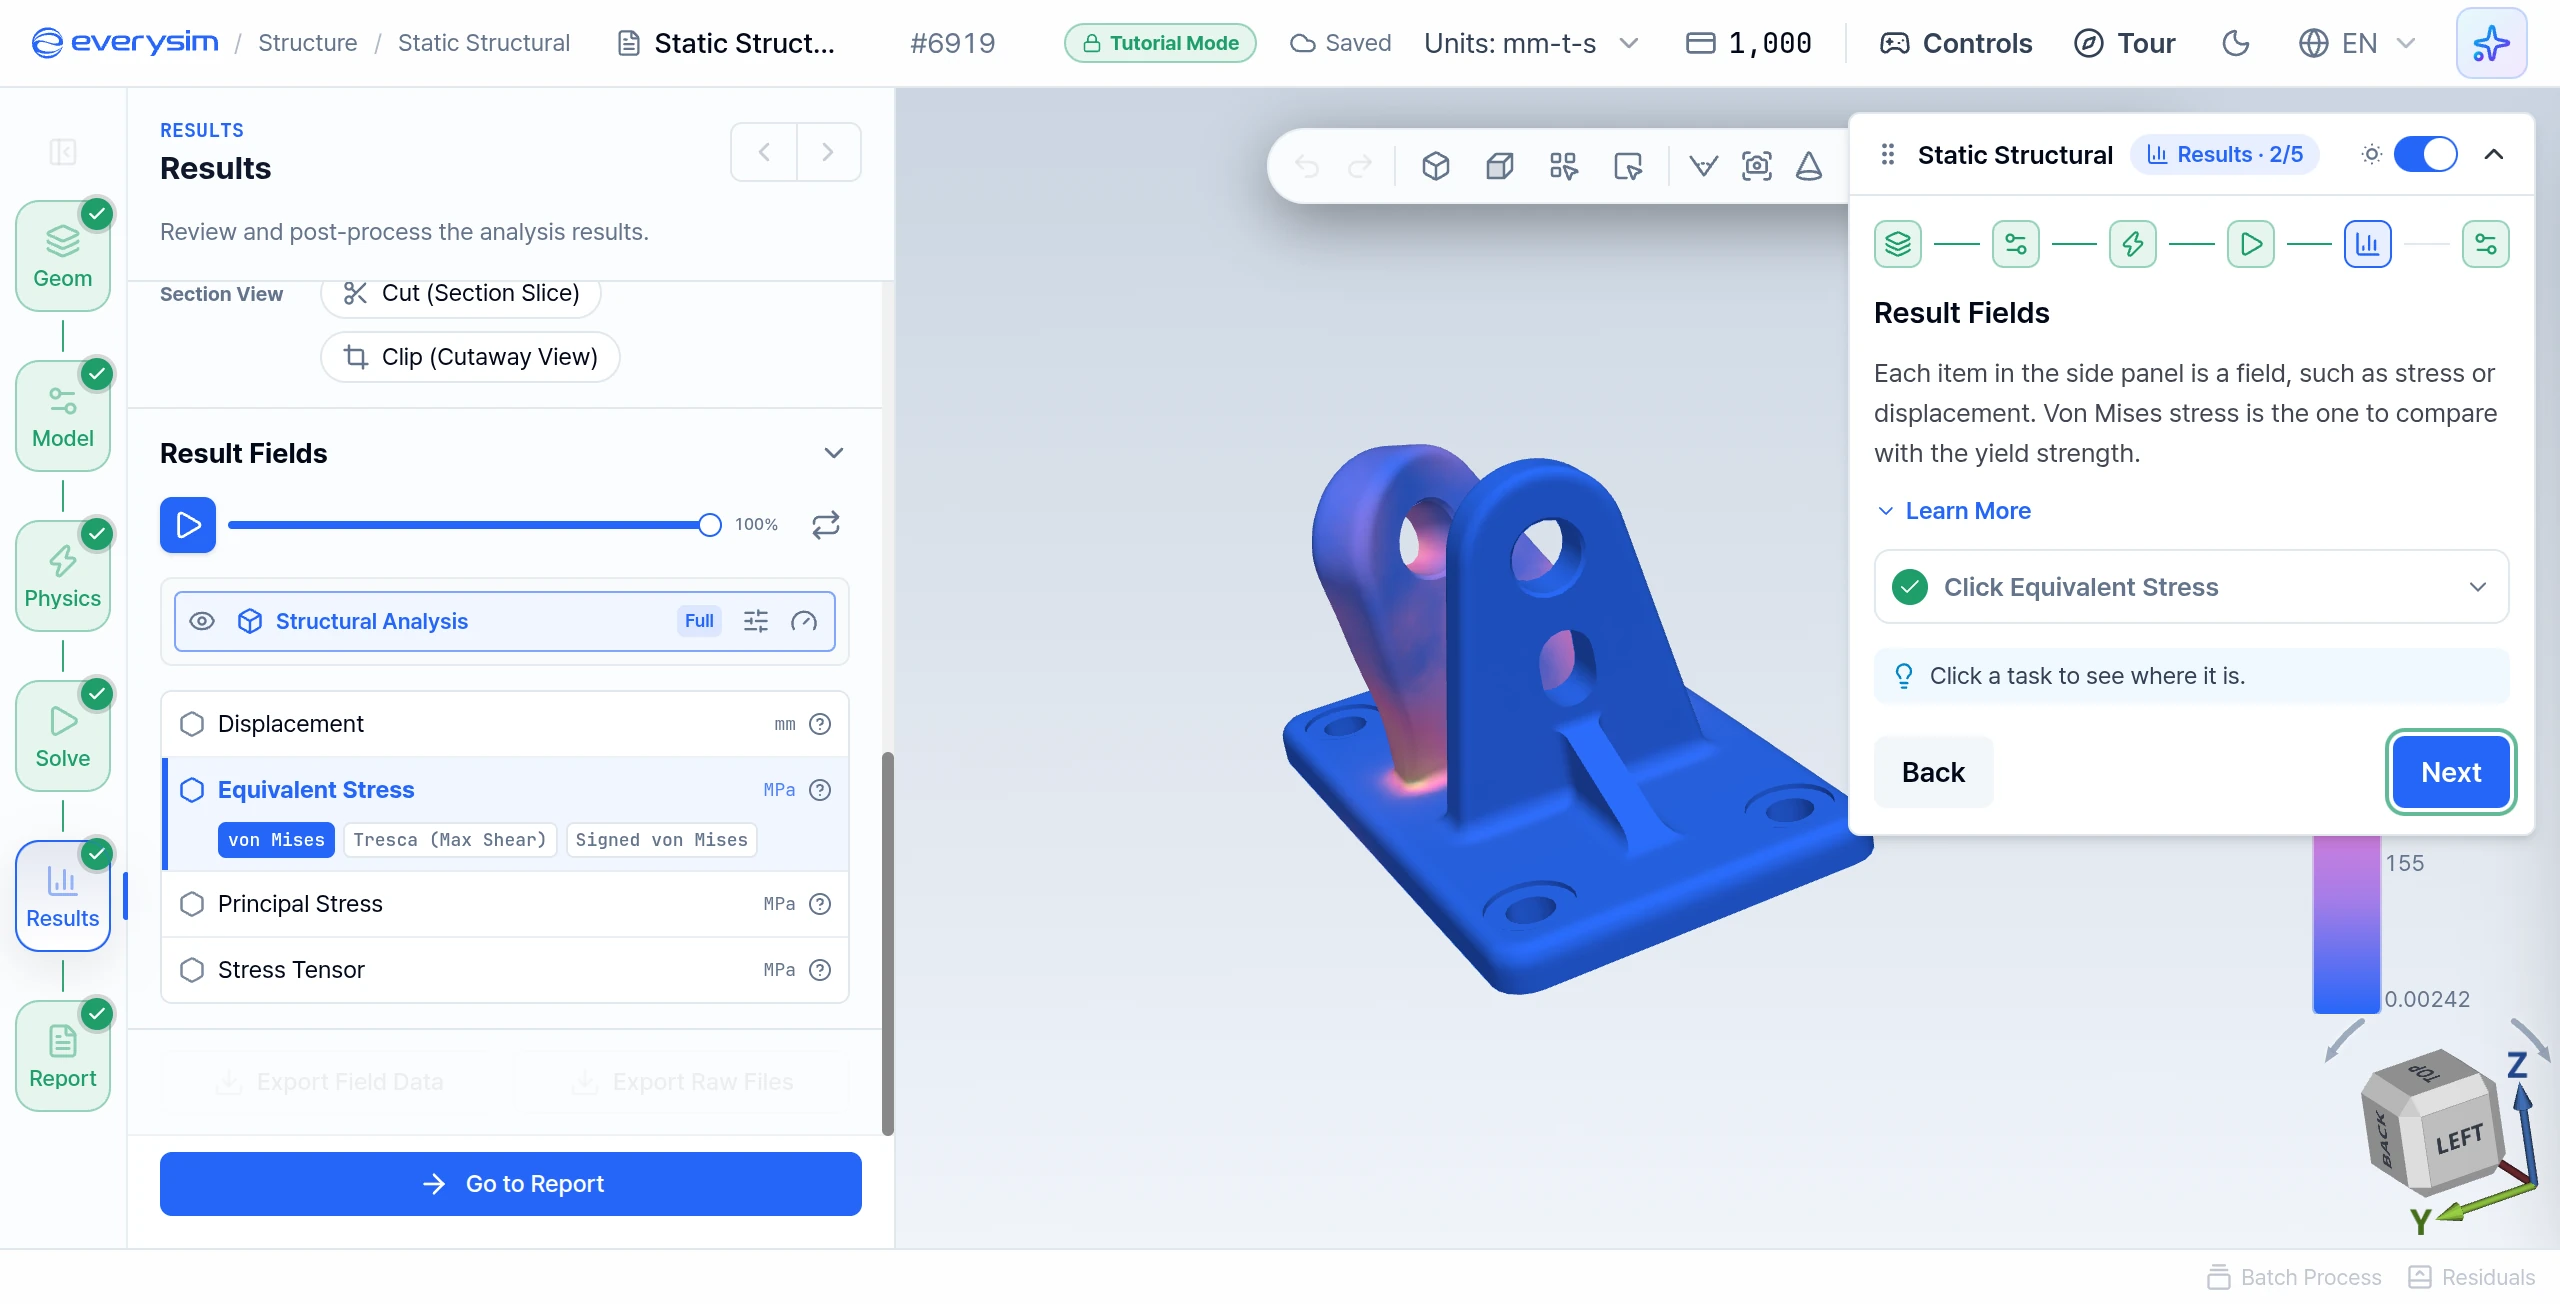
Each item in the side panel is a field, such as stress or displacement. Stress is the internal force the material carries per unit area. Von Mises stress combines it into one value that can be compared with the yield strength.
- Click Equivalent Stress: it opens on von Mises, which shows where the stress is highest under these conditions.
10. Displacement Animation
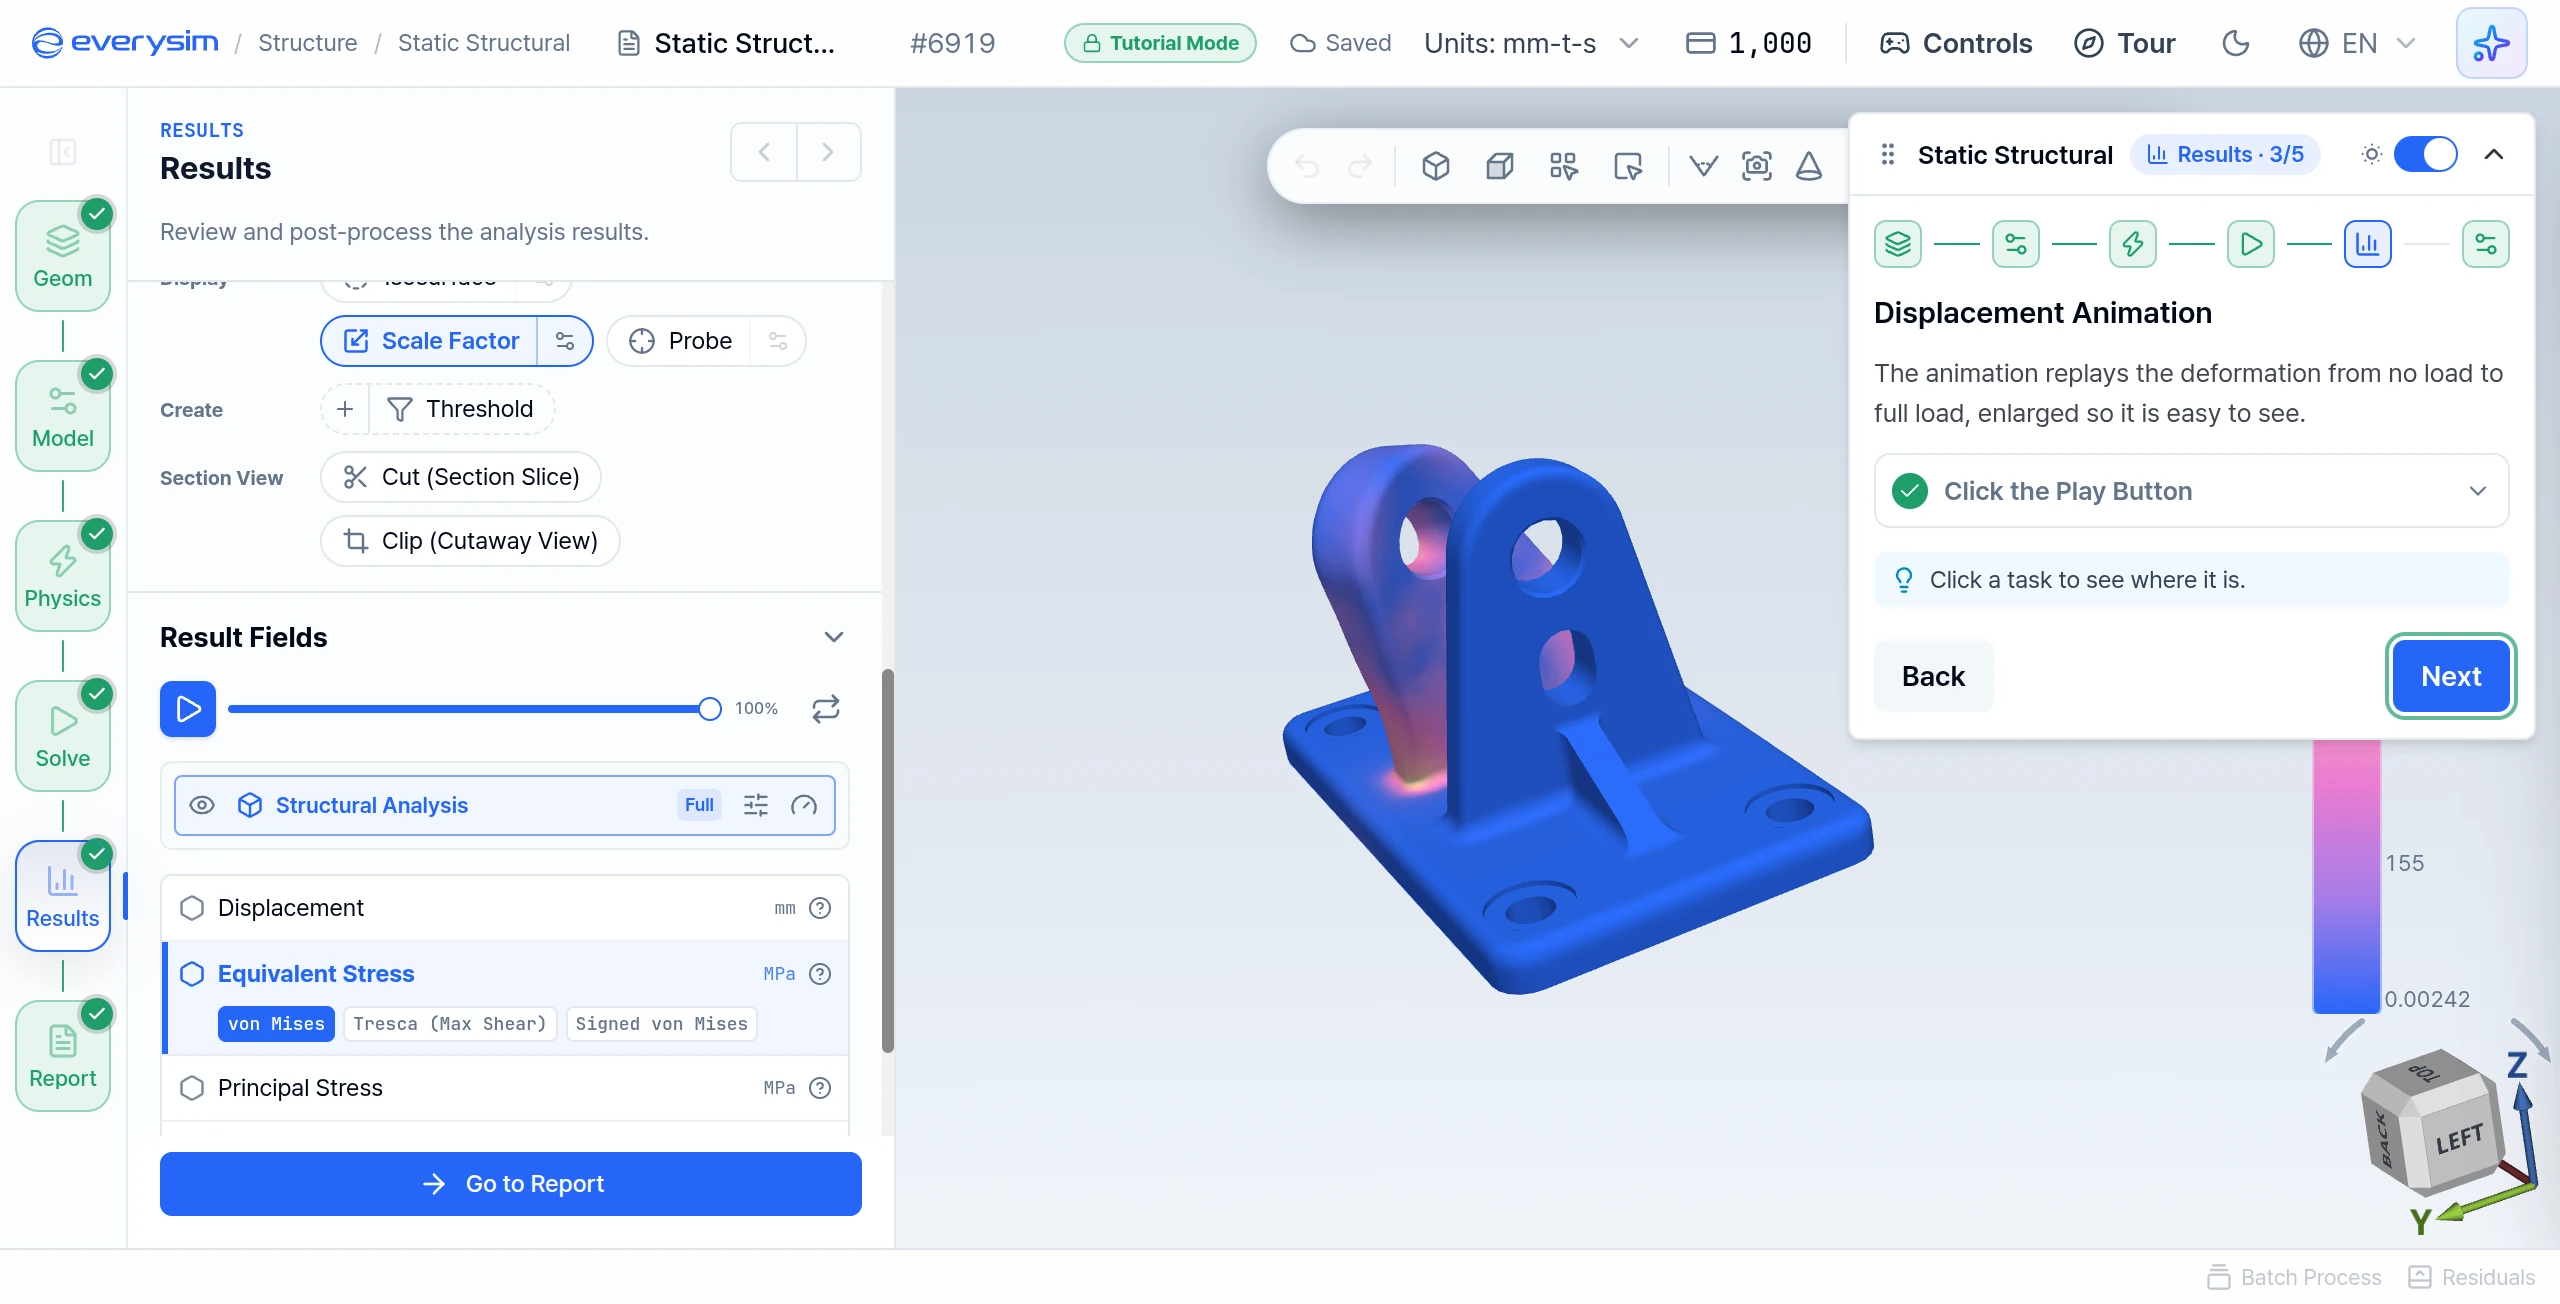
The animation replays the deformation from no load to full load, enlarged so it is easy to see.
- Click the Play Button: press play above the result fields and watch to the end. The lug bends sideways along +Y while the base stays put.
11. Change the Color Map
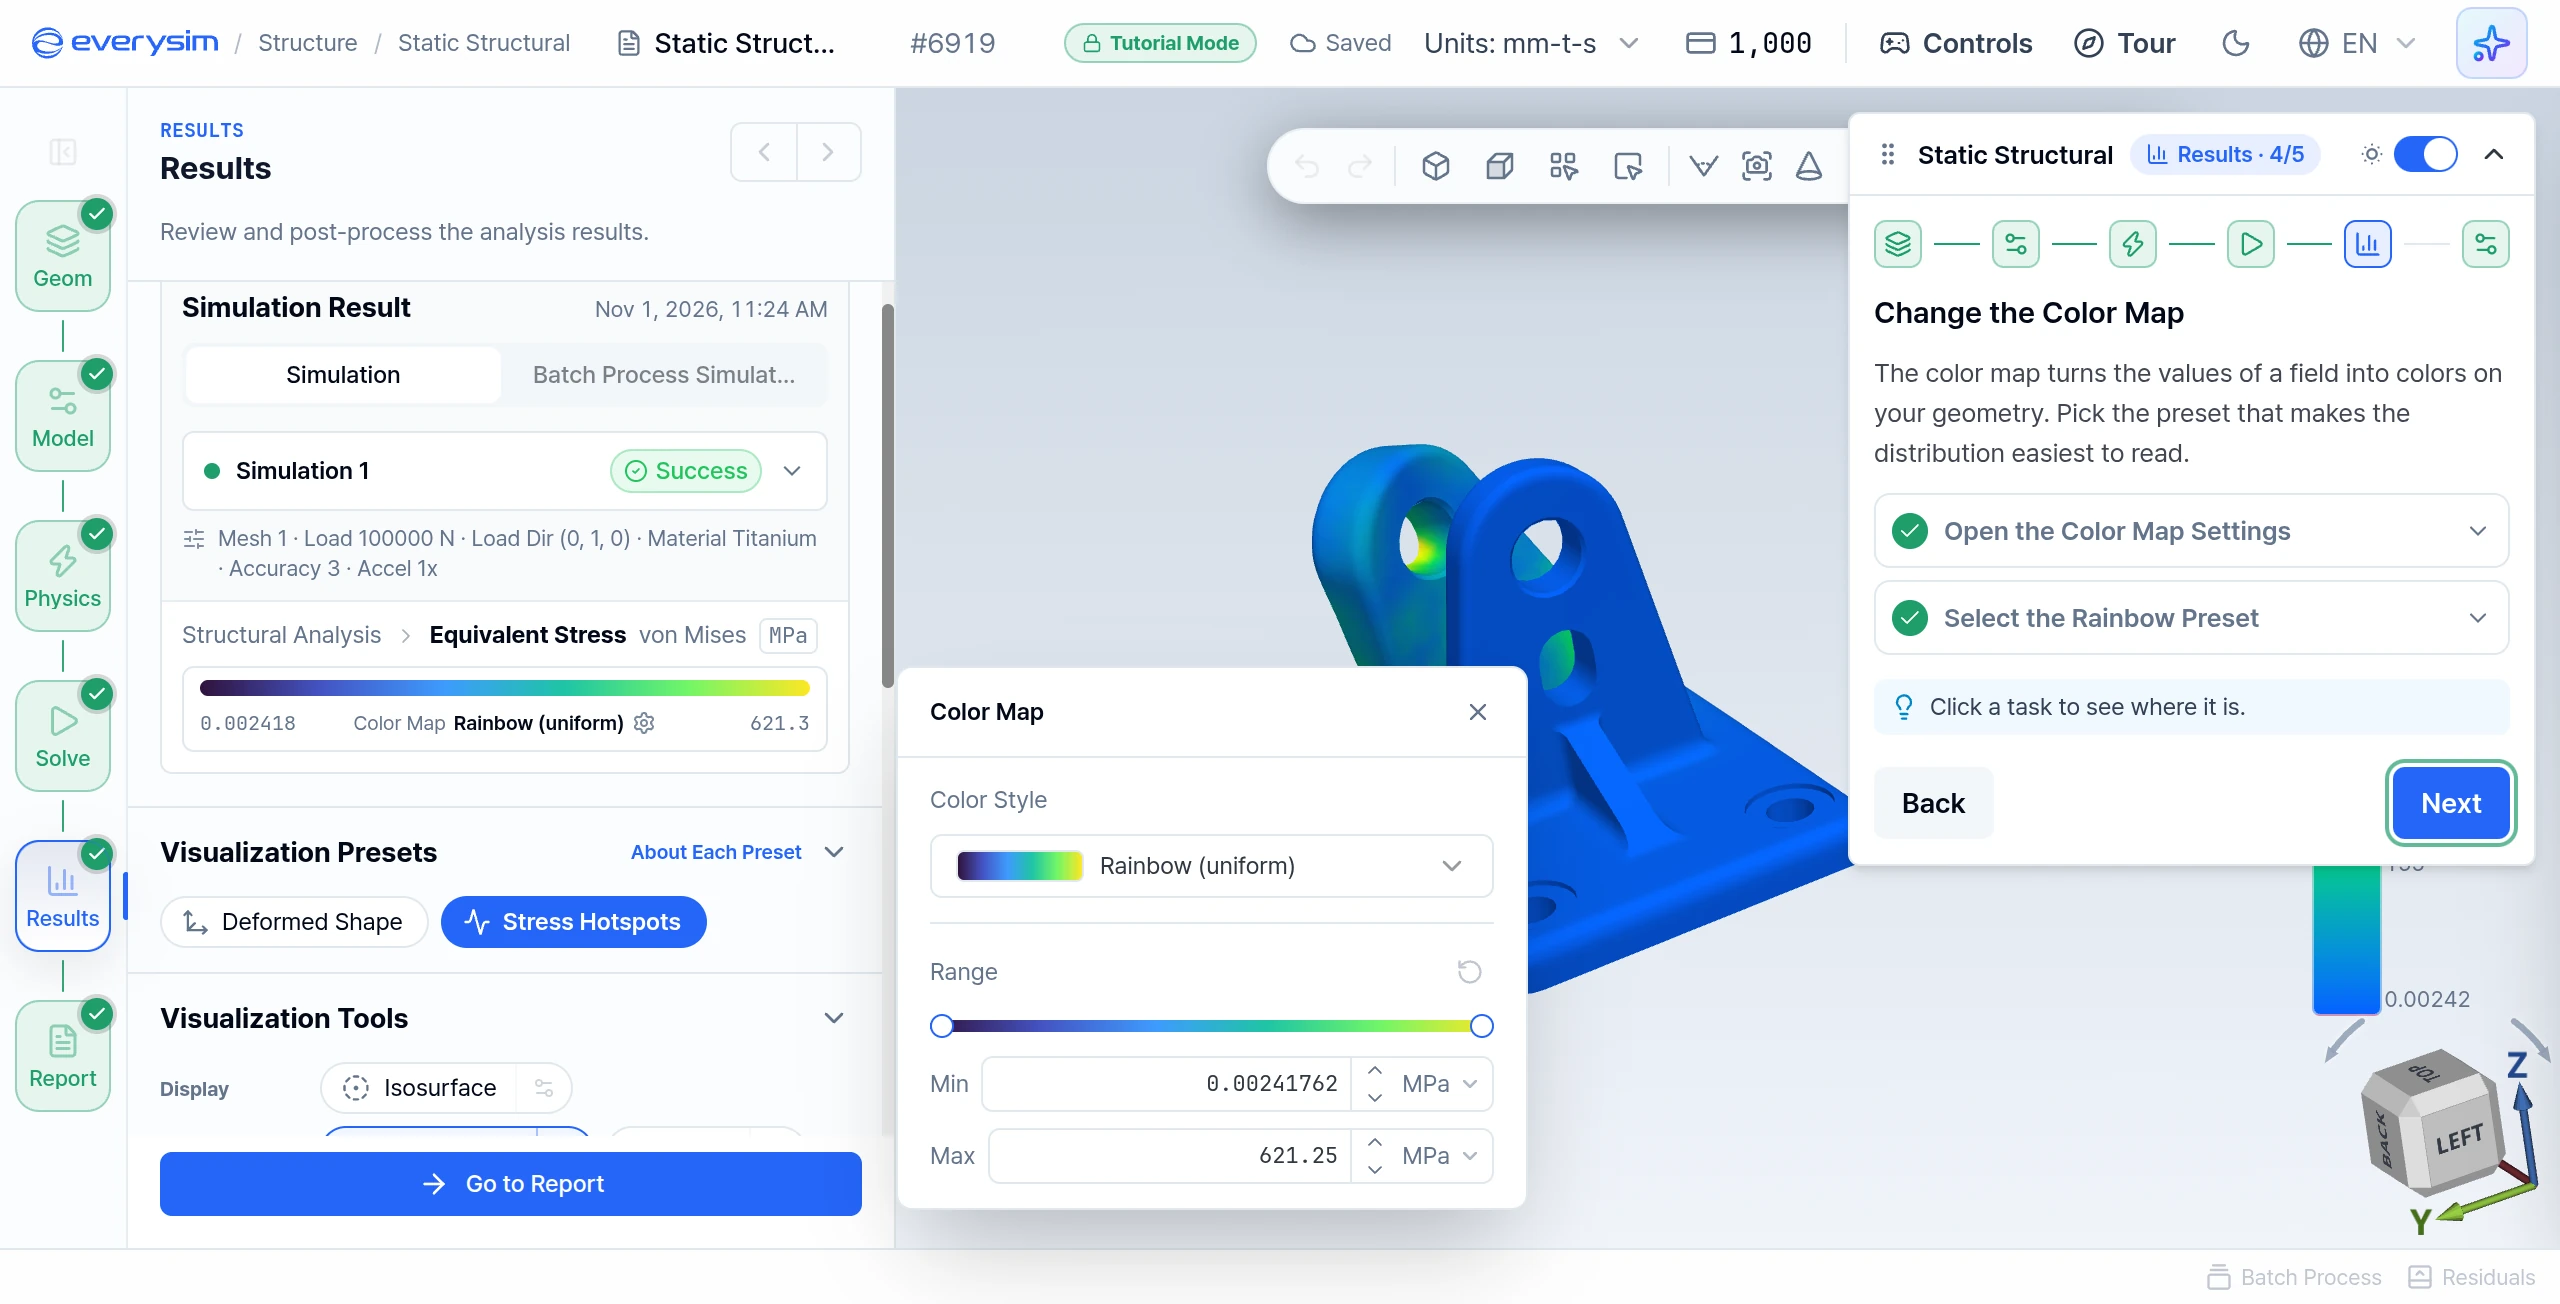
The color map turns the values of a field into colors on the geometry.
- Open the Color Map Settings: click the color map bar in the Simulation Result card.
- Select the Rainbow Preset: choose Rainbow (uniform) under Color Style.
12. Report
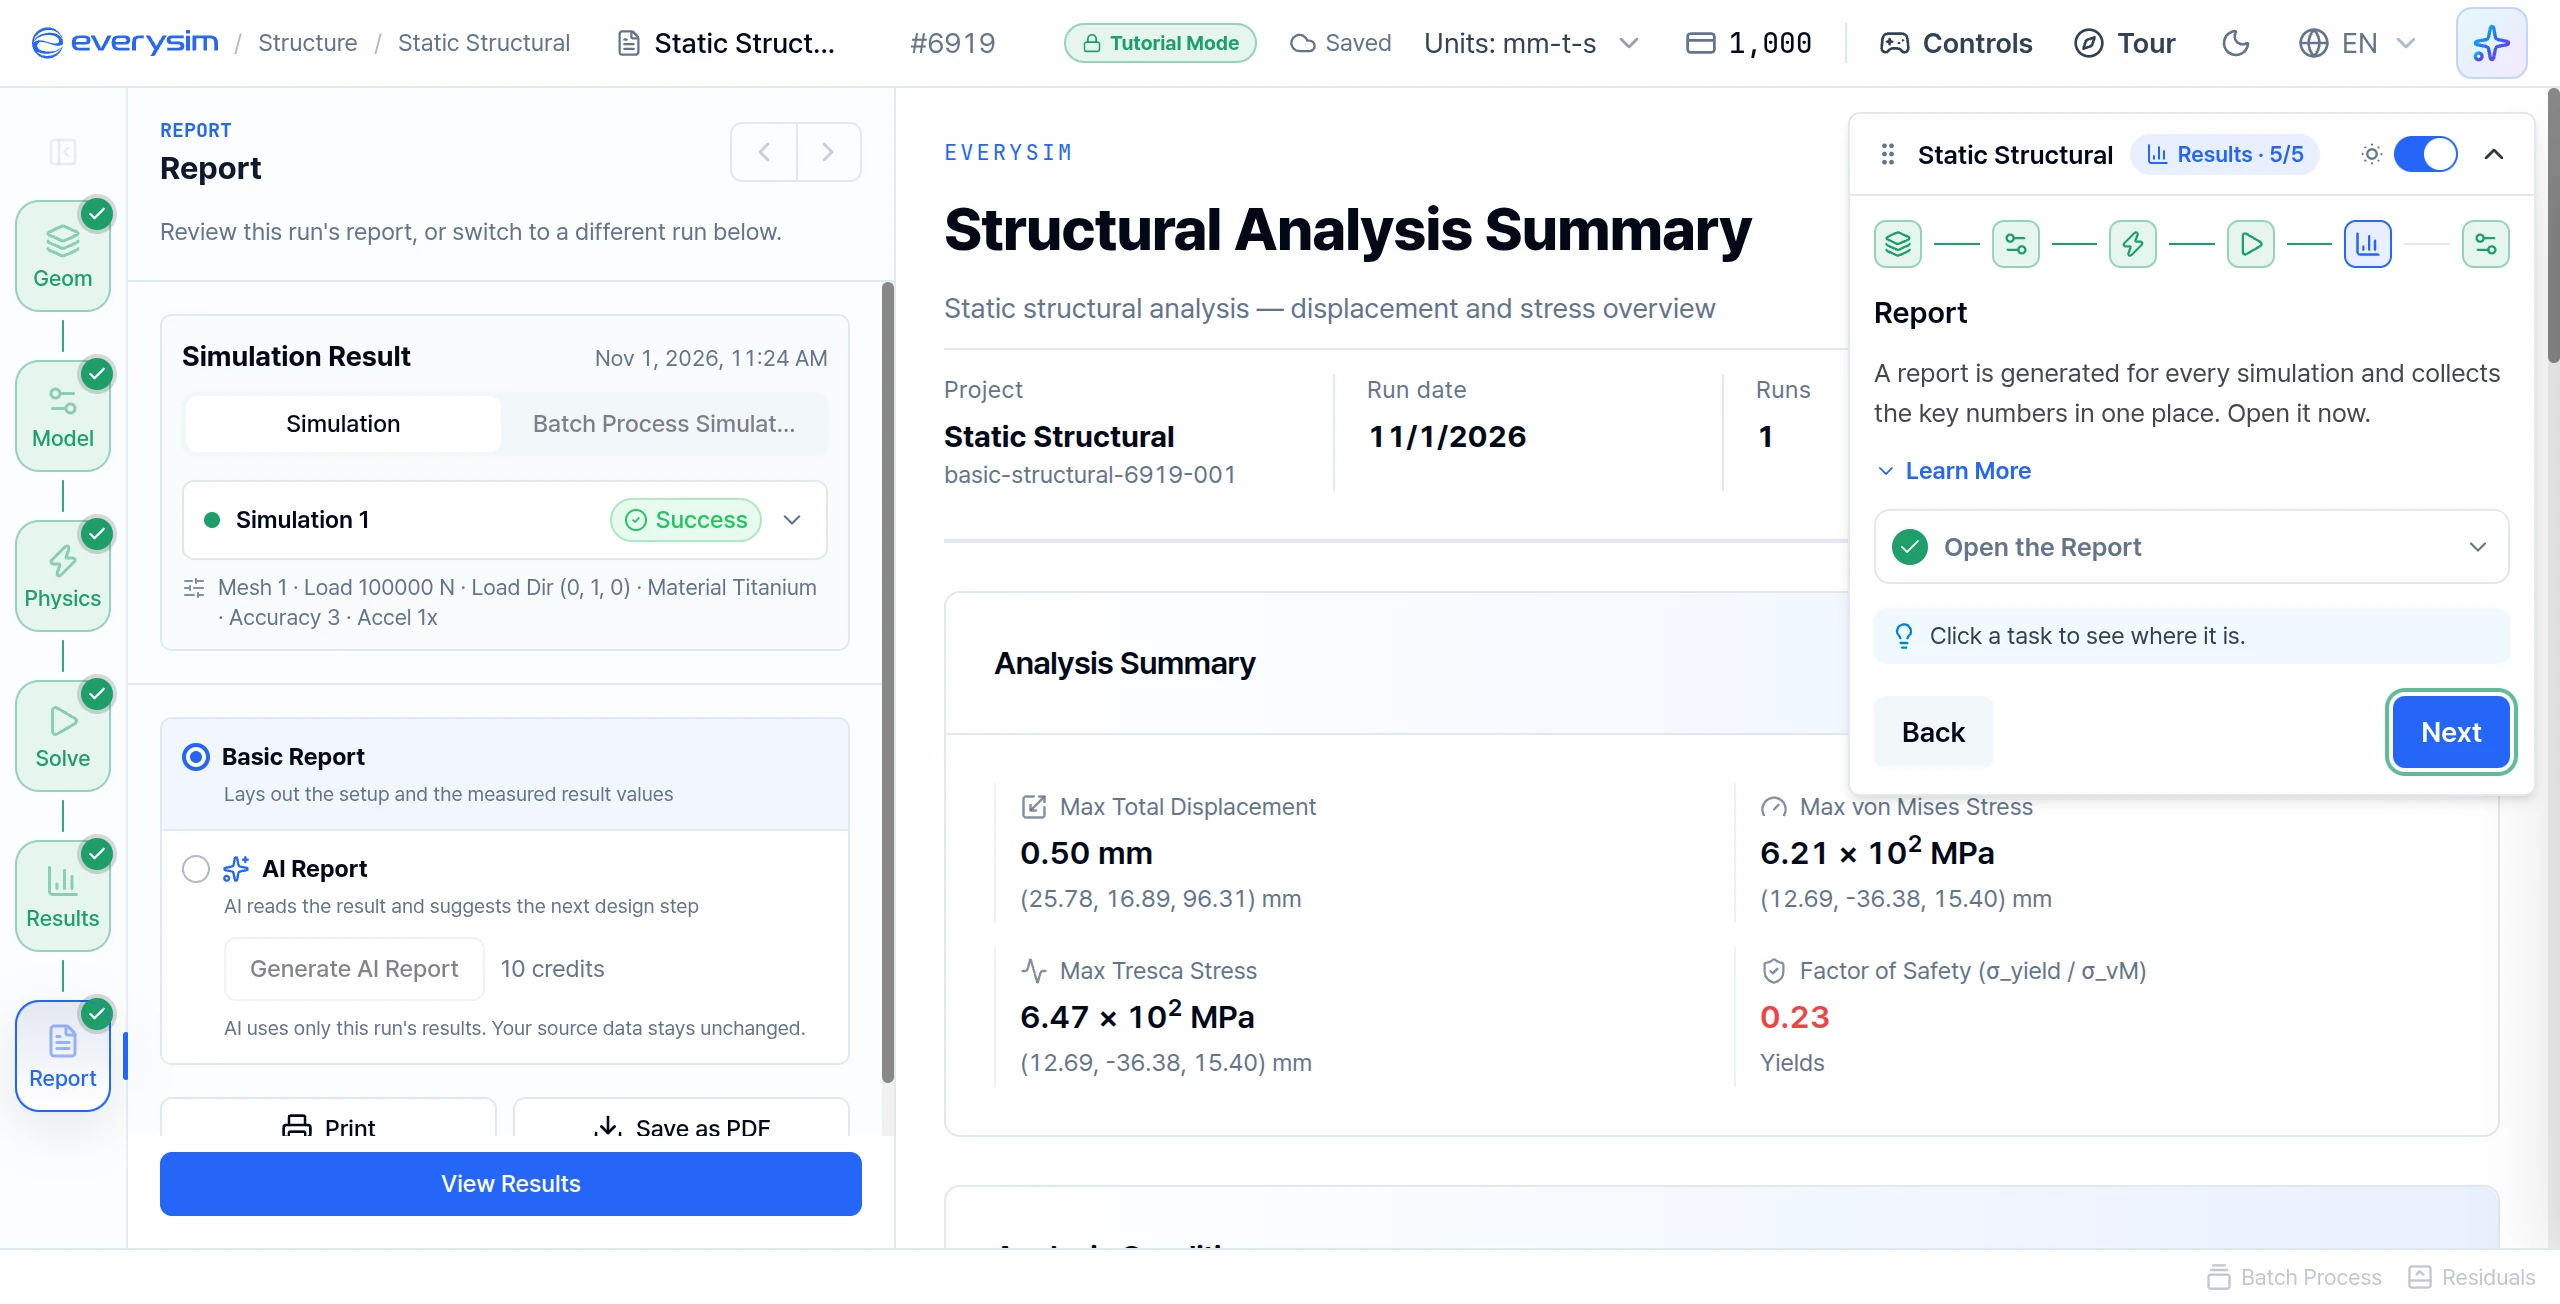
A report is generated for every simulation and collects the key numbers in one place.
- Open the Report: click Go to Report at the bottom of the panel. The guide moves on by itself.
13. Analysis Summary
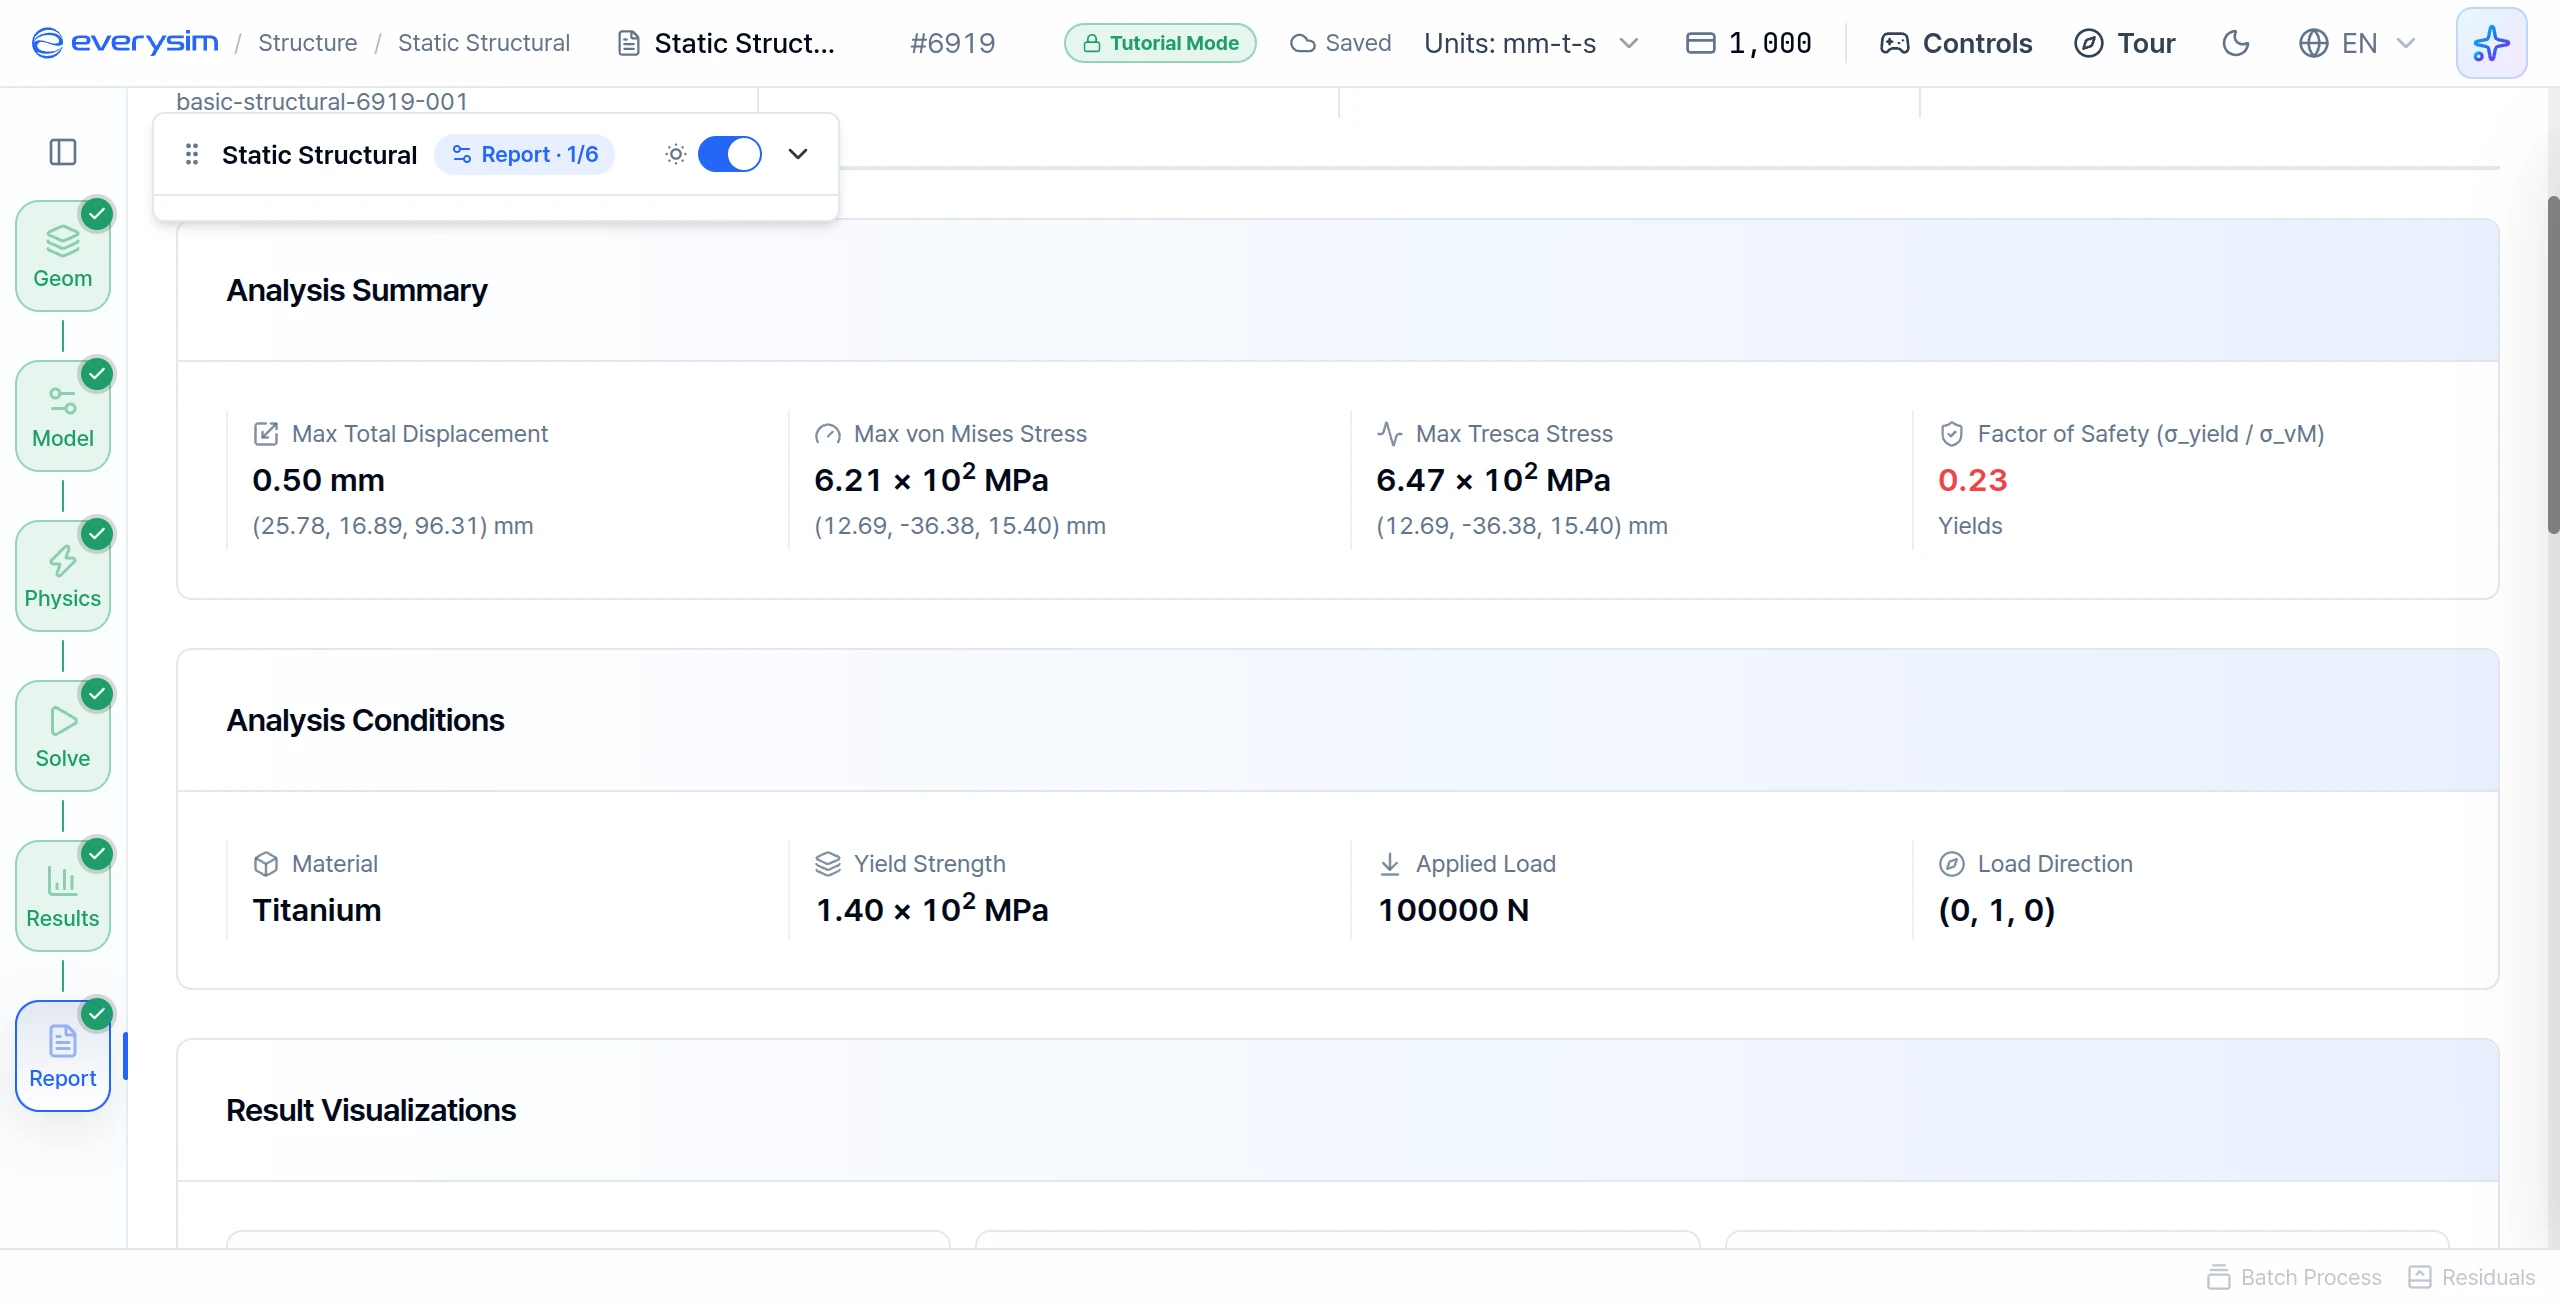
The report starts with the analysis summary. The prepared result reads:
| Report item | Value |
|---|---|
| Max Total Displacement | 0.50 mm |
| Max von Mises Stress | 6.21 × 10² MPa |
| Max Tresca Stress | 6.47 × 10² MPa |
| Factor of Safety (σ_yield / σ_vM) | 0.23, Yields |
The factor of safety is the yield strength divided by the highest stress:
Below 1 the material yields. Here the highest stress is far above titanium's yield strength, so the factor of safety is below 1 and this bracket would yield under this force.
14. Analysis Conditions
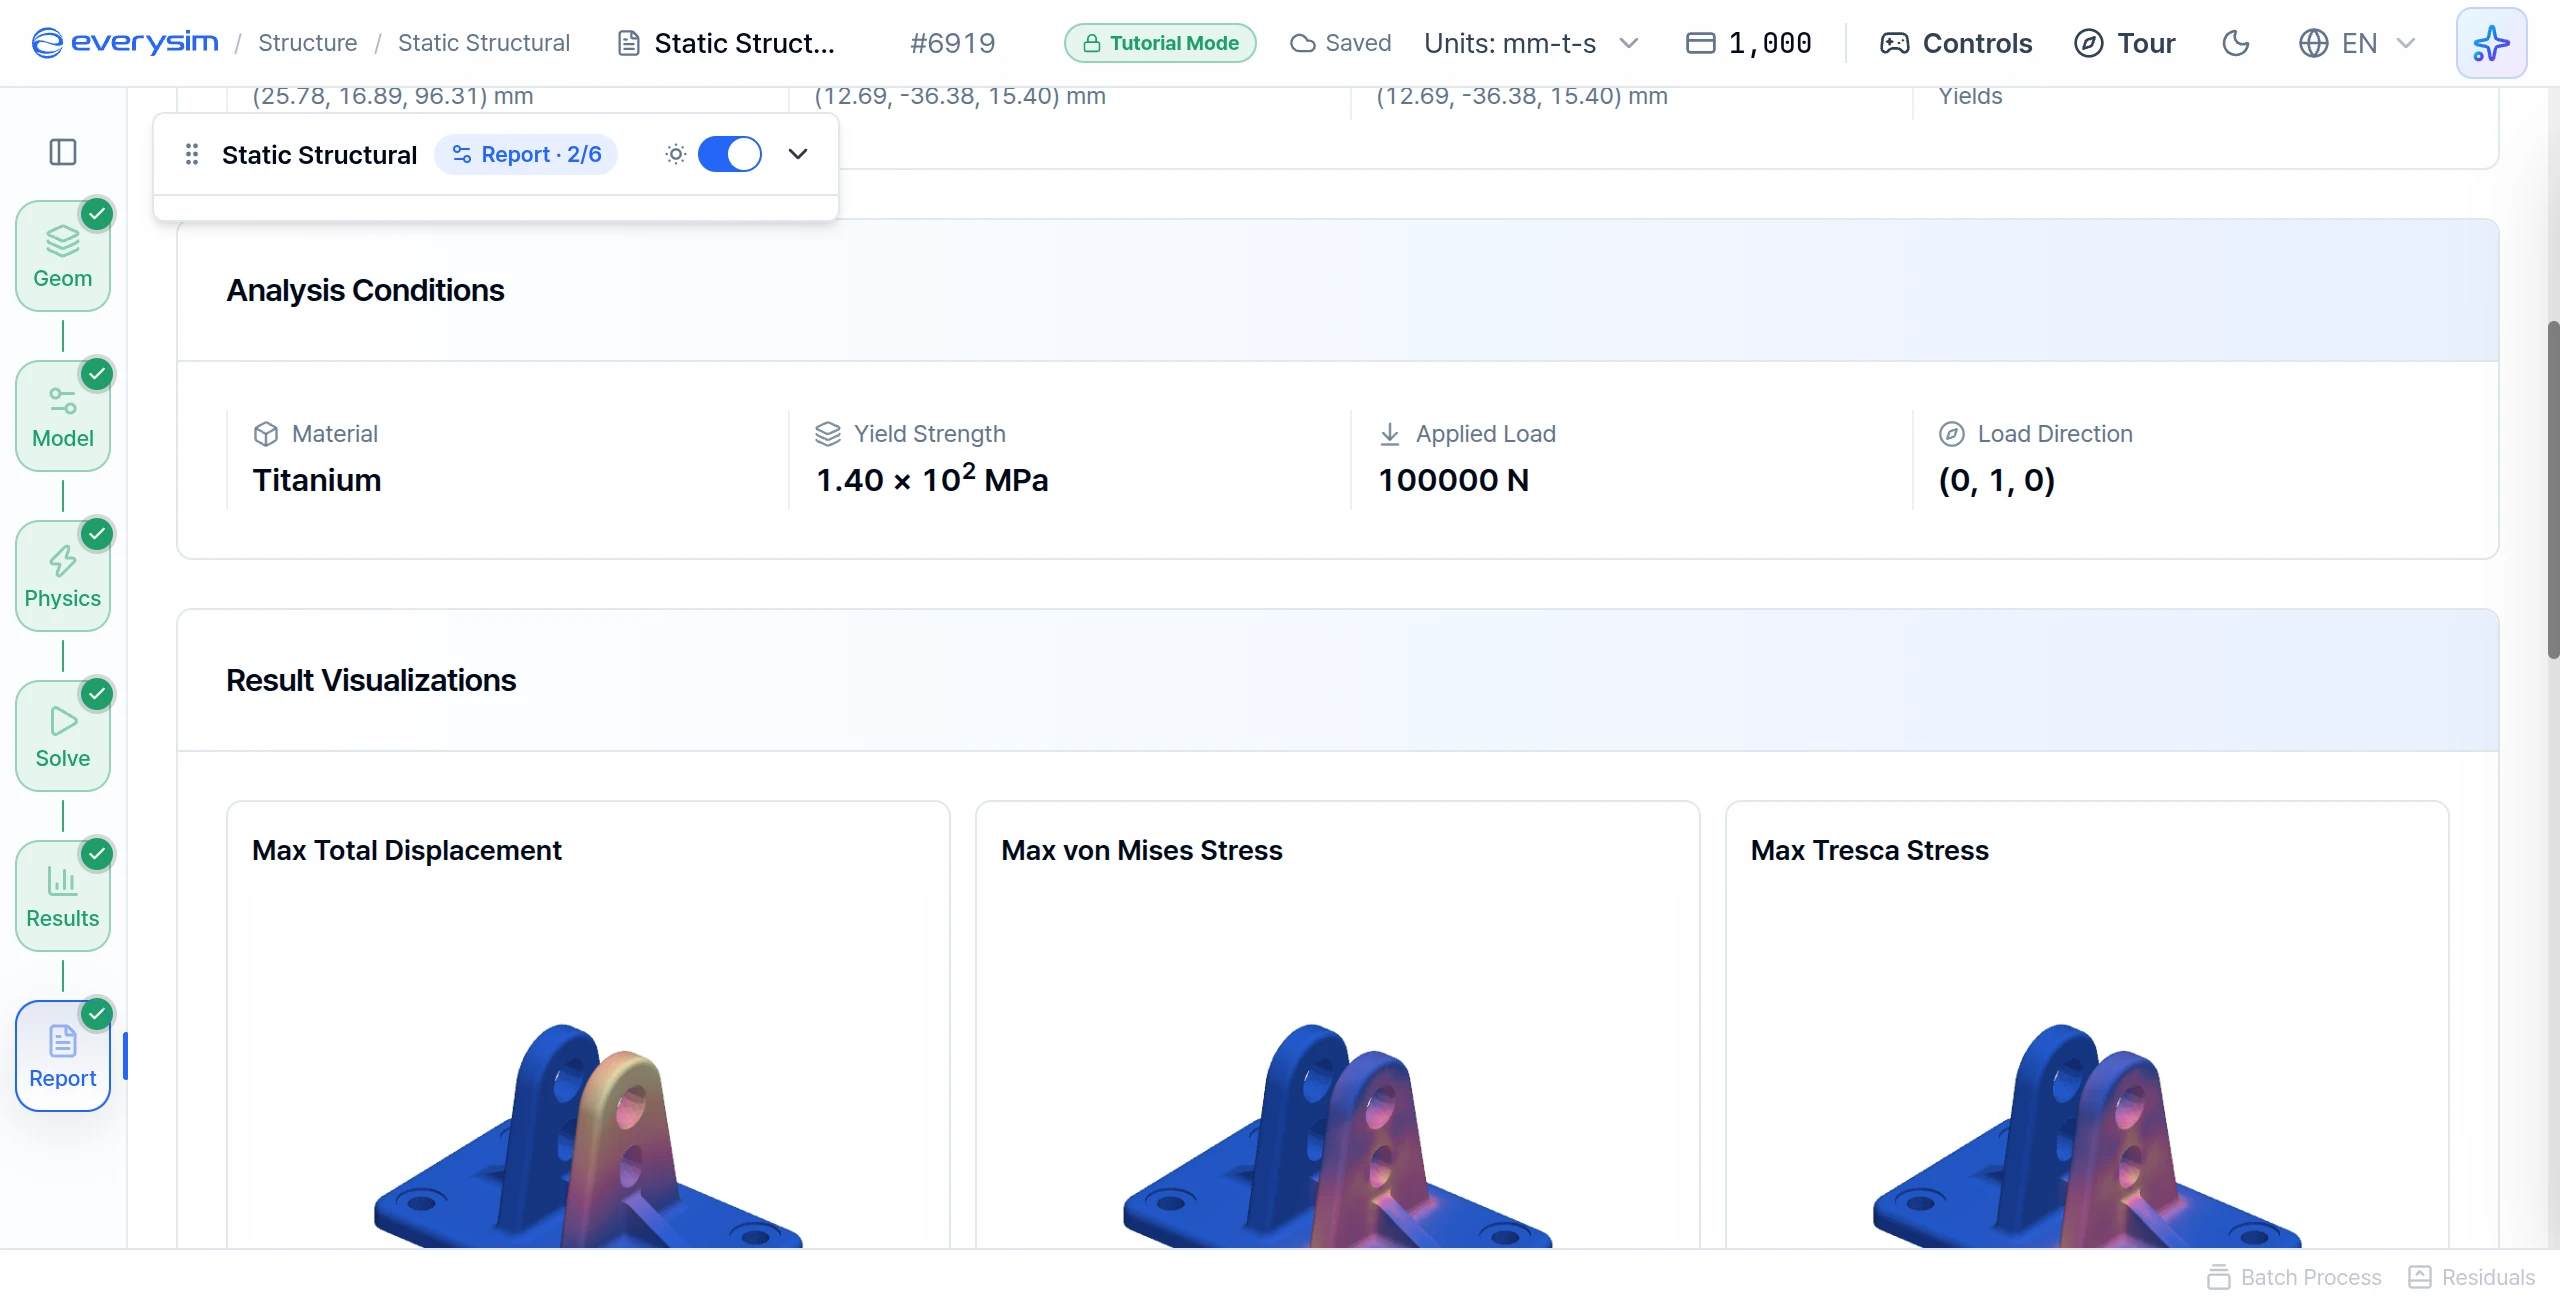
This section lists what the analysis was run with, so every number can be read against its setup.
| Report item | Value |
|---|---|
| Material | Titanium |
| Yield Strength | 1.40 × 10² MPa |
| Applied Load | 100000 N |
| Load Direction | (0, 1, 0) |
15. Result Visualizations
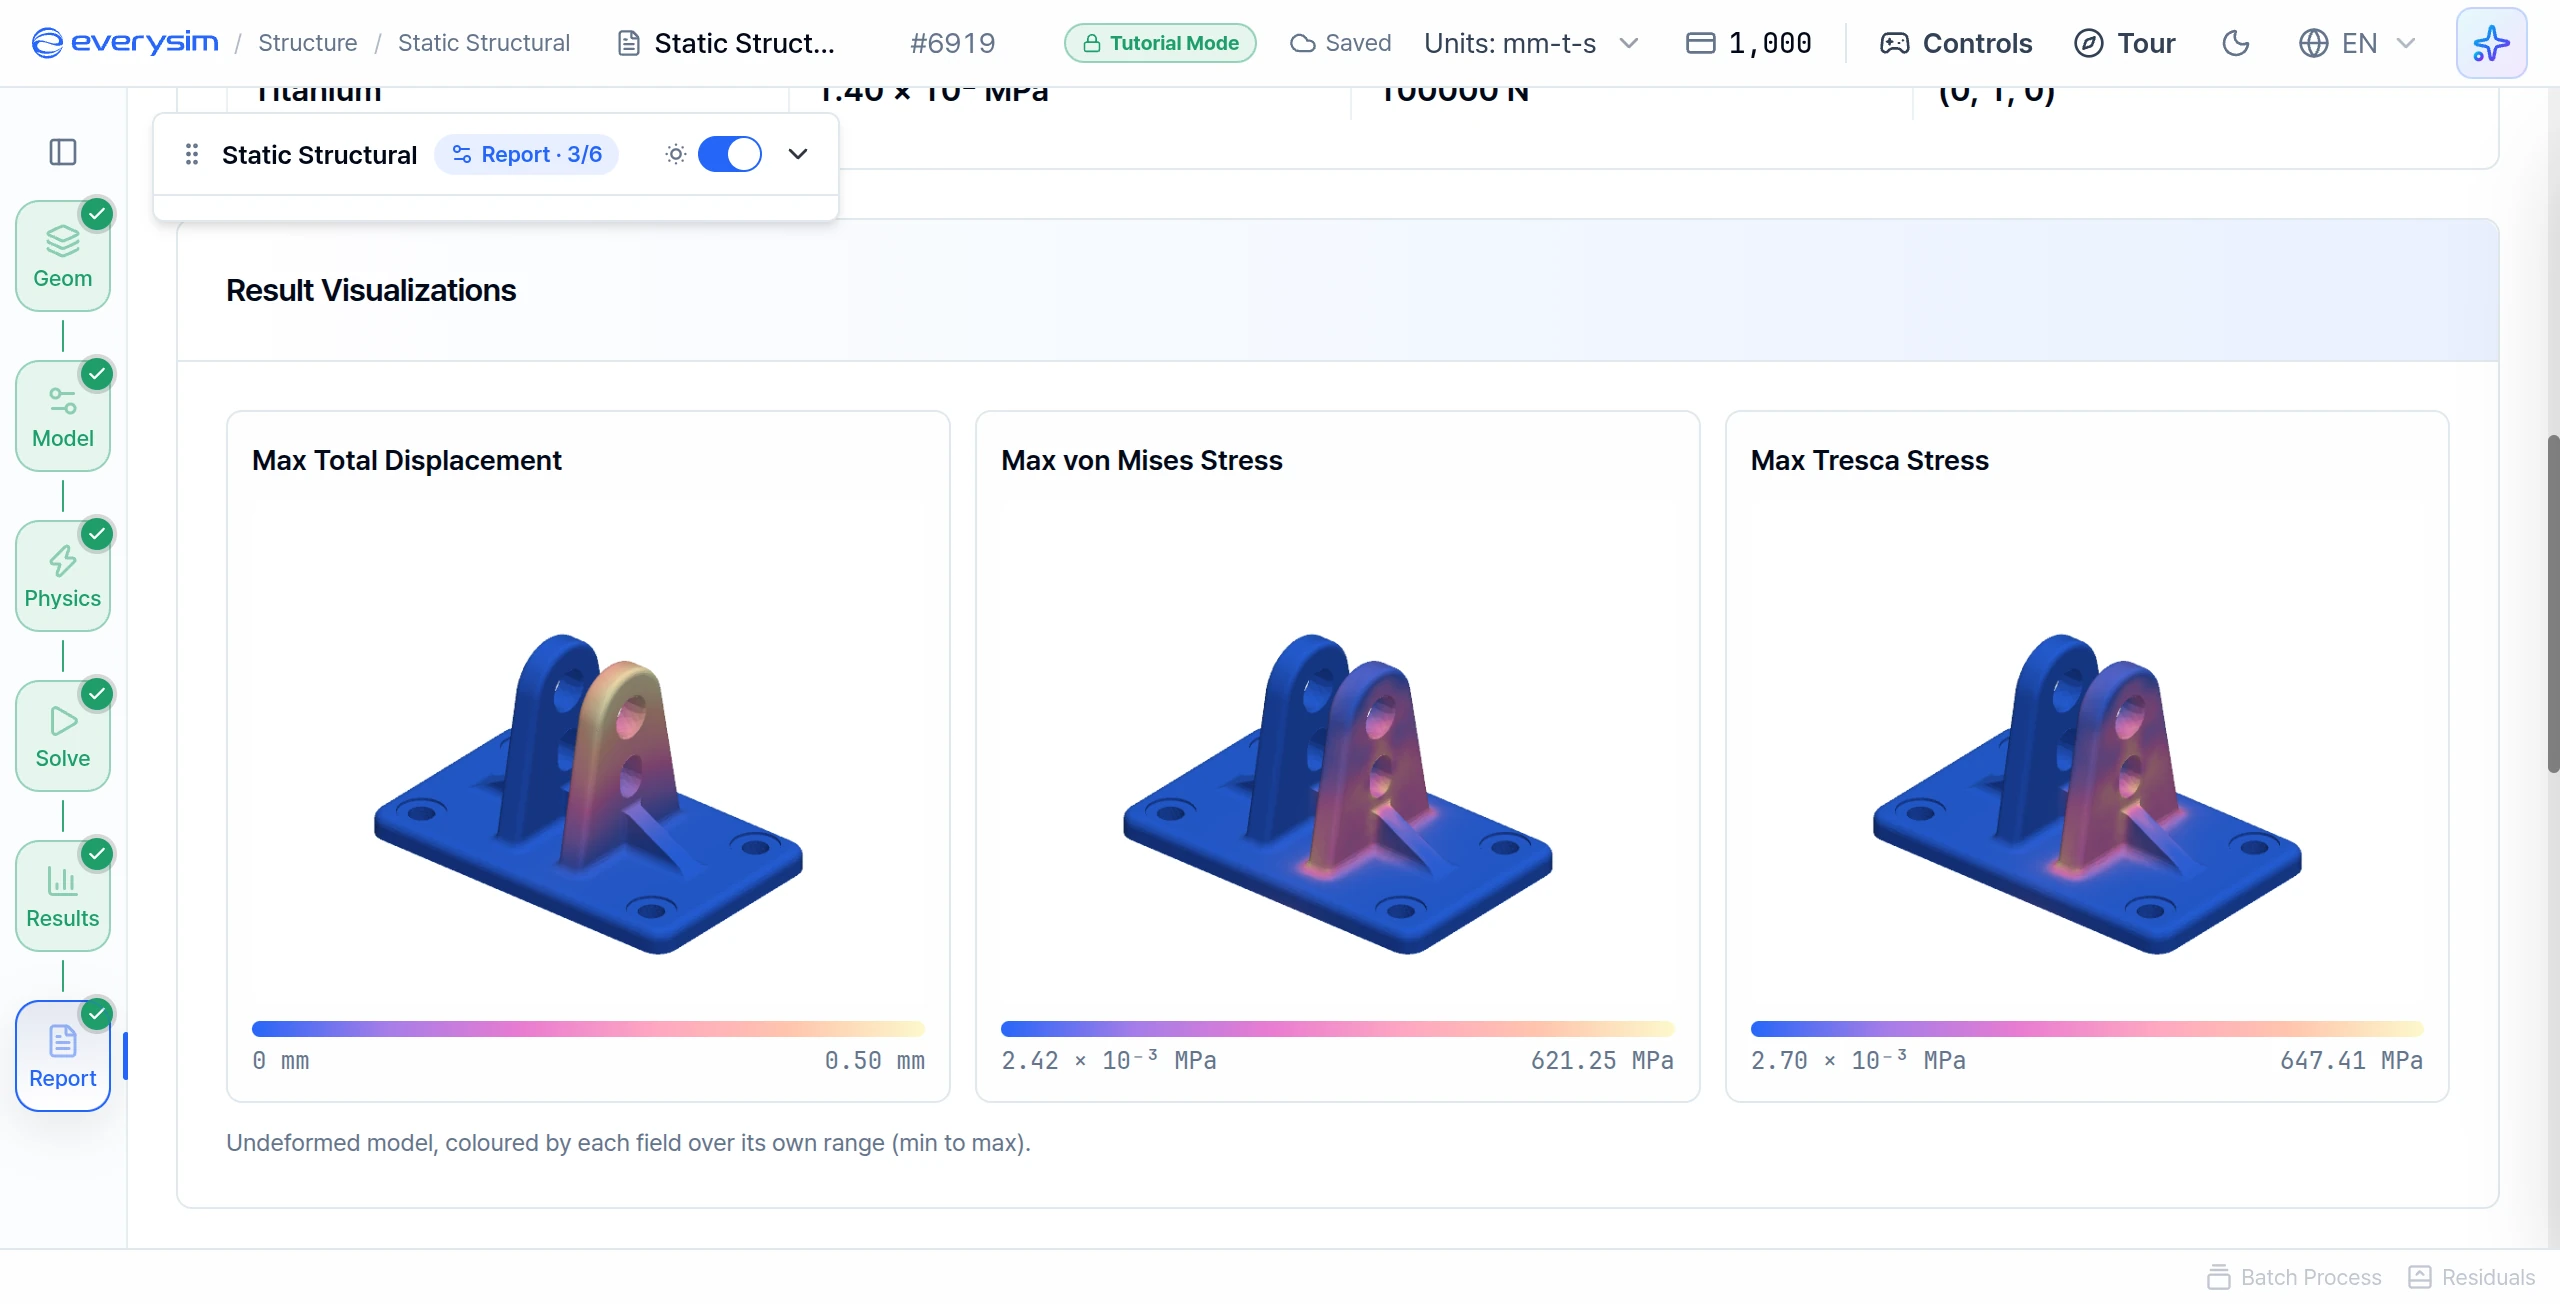
Three pictures show where the values are as well as how large: Max Total Displacement (0 to 0.50 mm), Max von Mises Stress (up to 621.25 MPa) and Max Tresca Stress (up to 647.41 MPa). Von Mises and Tresca are two ways of combining the stresses at a point into one number. Each picture is coloured over its own range on the undeformed shape.
16. Engineering Insights
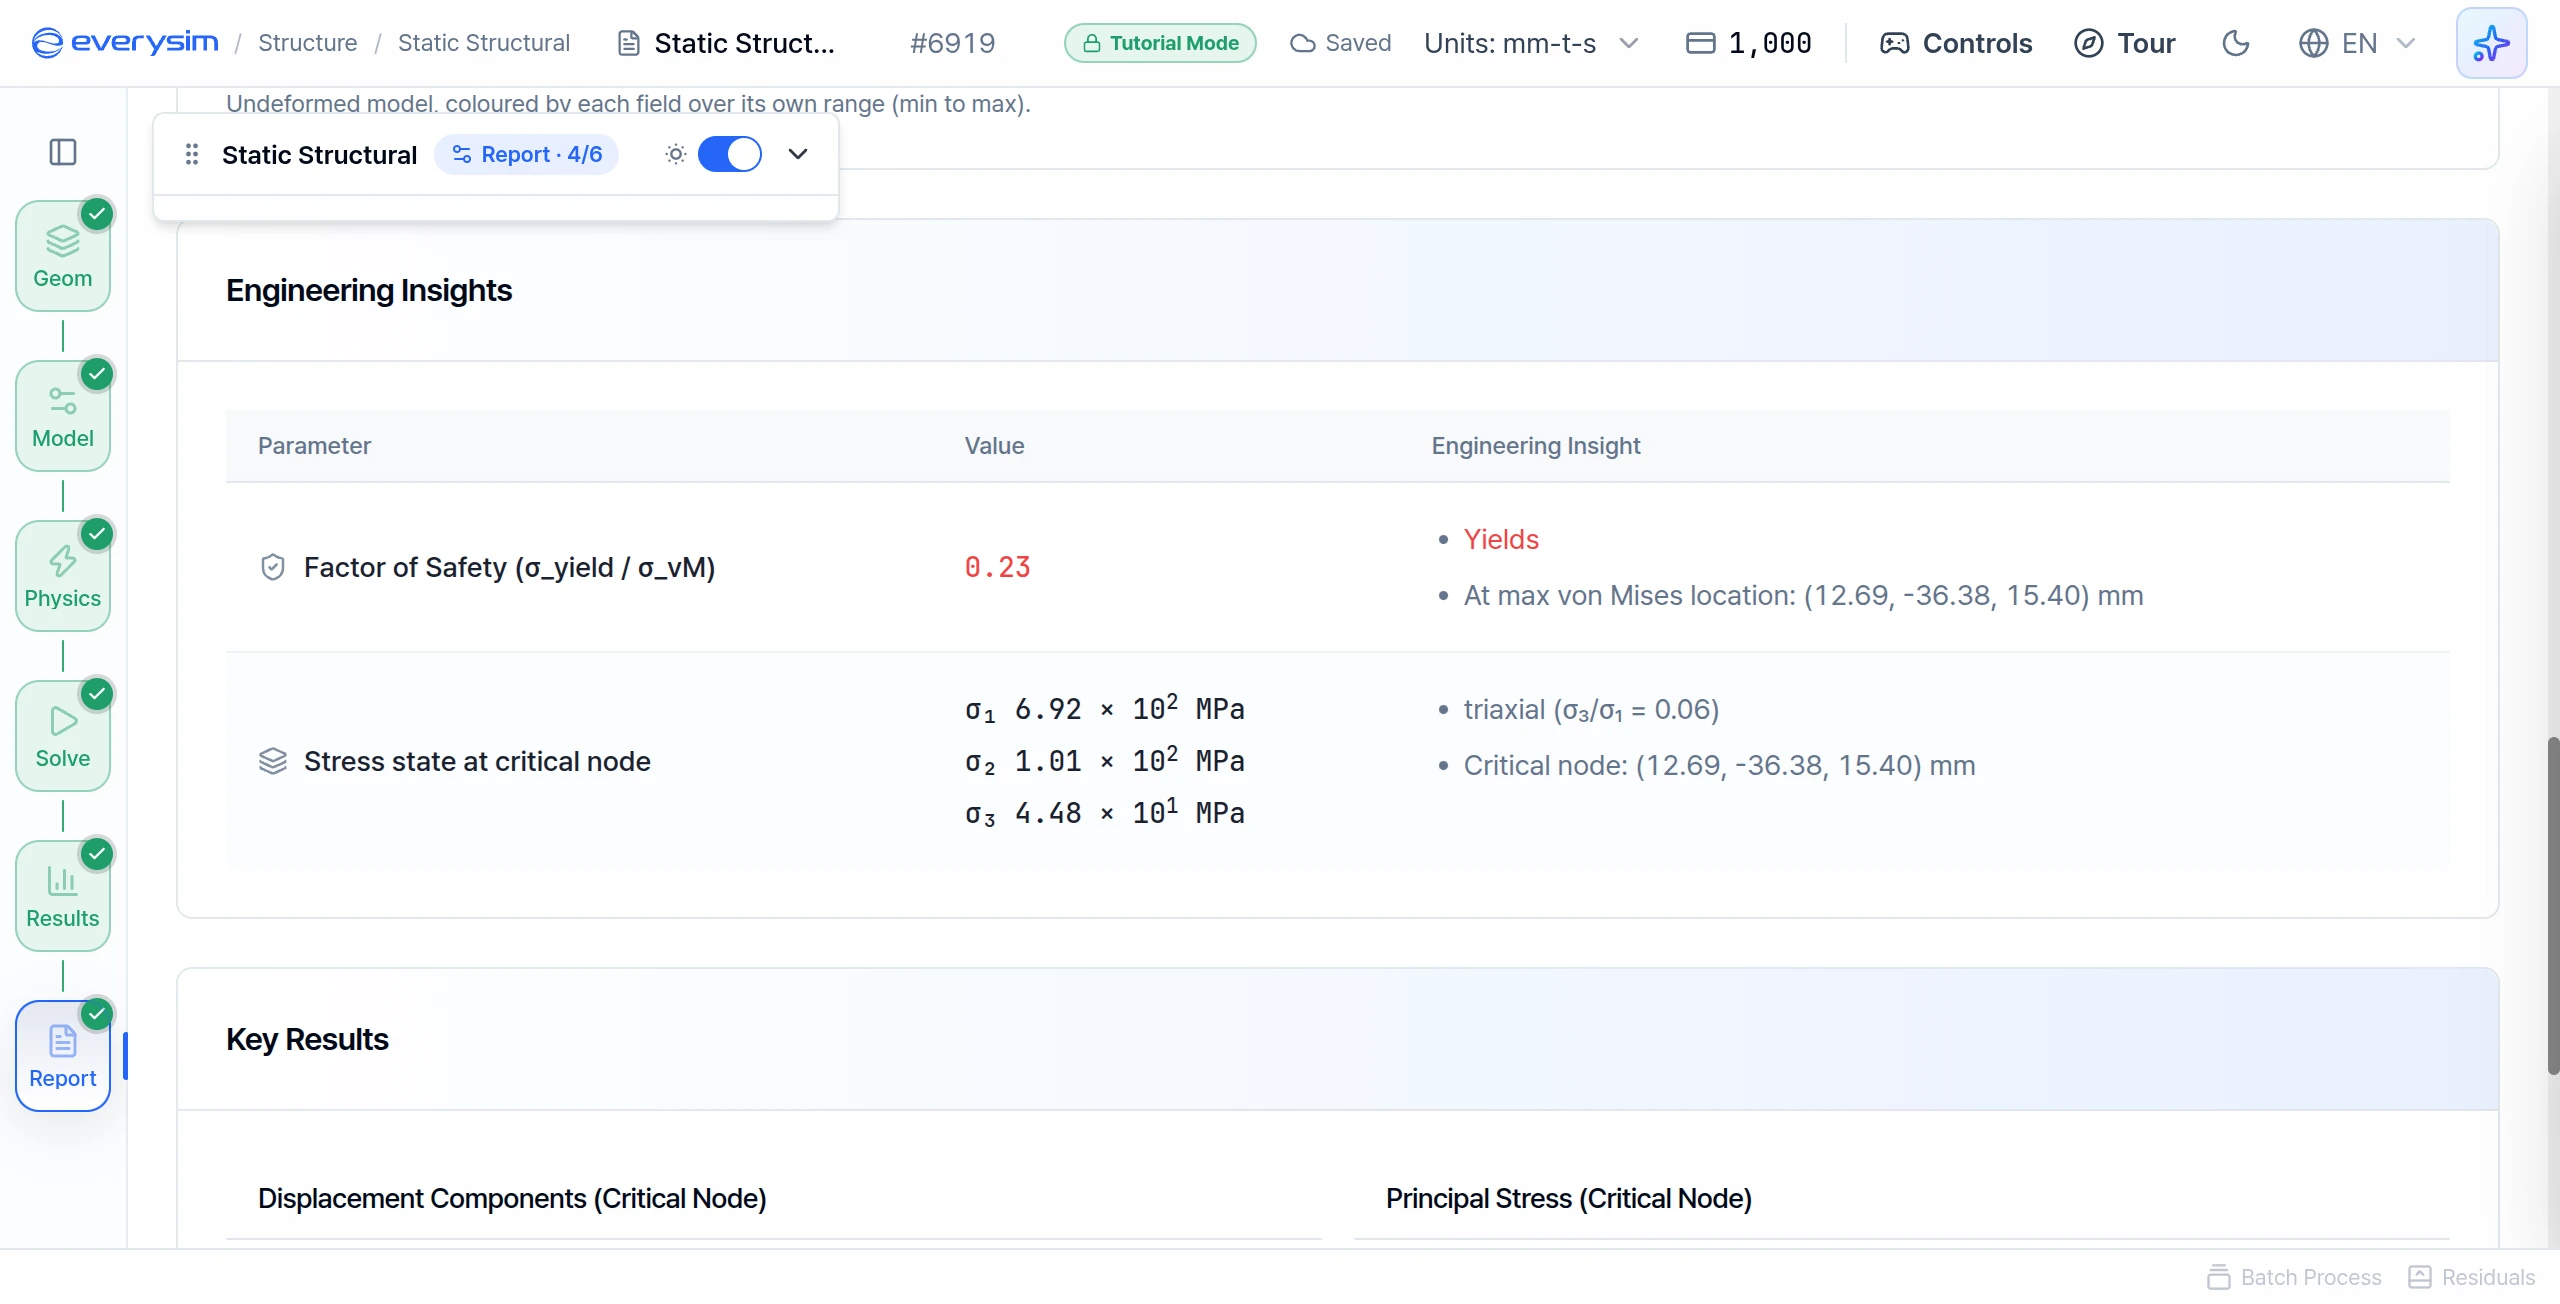
This table turns the numbers into a judgement.
- Factor of Safety:
0.23, Yields, with the highest von Mises stress at (12.69, -36.38, 15.40) mm. - Stress state at critical node: σ₁ 6.92 × 10² MPa, σ₂ 1.01 × 10² MPa, σ₃ 4.48 × 10¹ MPa, labelled triaxial (σ₃/σ₁ = 0.06).
- Critical node: the coordinates of that point, so you can find it on the model.
17. Displacement Components
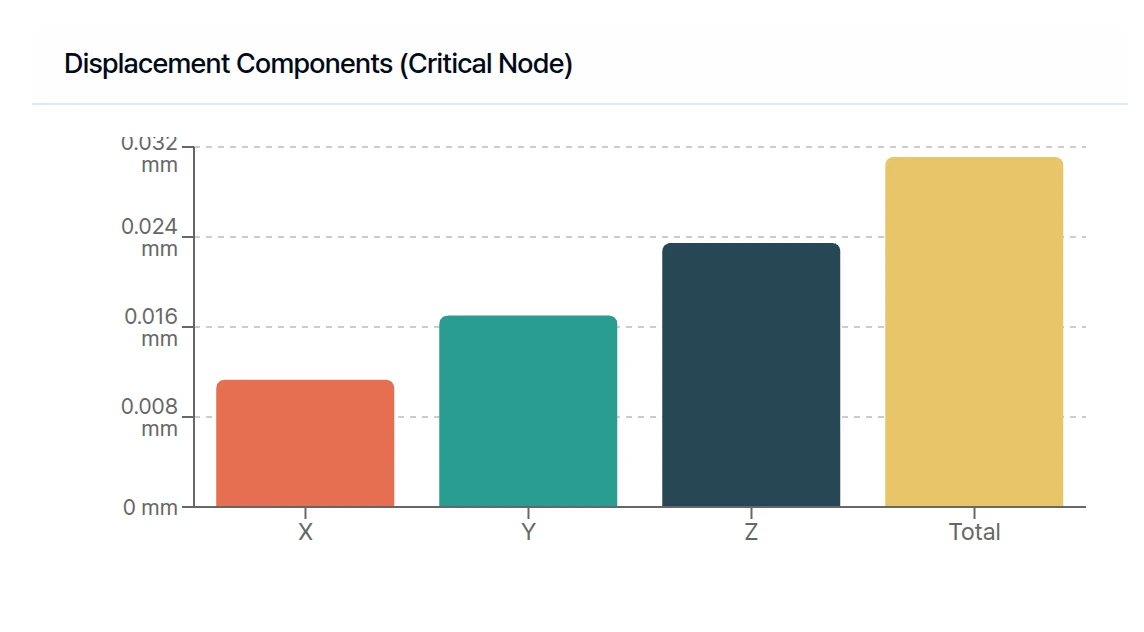
The last section, Key Results, has two charts. The critical node is the point of the part with the highest value. This chart splits its displacement into X, Y and Z.
The largest part is along Z, and the bar points up: the point moved in the +Z direction. Y is a little smaller and also positive, so it moved toward +Y too, the way the lug is pushed. X is the smallest. Total is the overall distance, which is why it is taller than any single bar.
18. Principal Stress
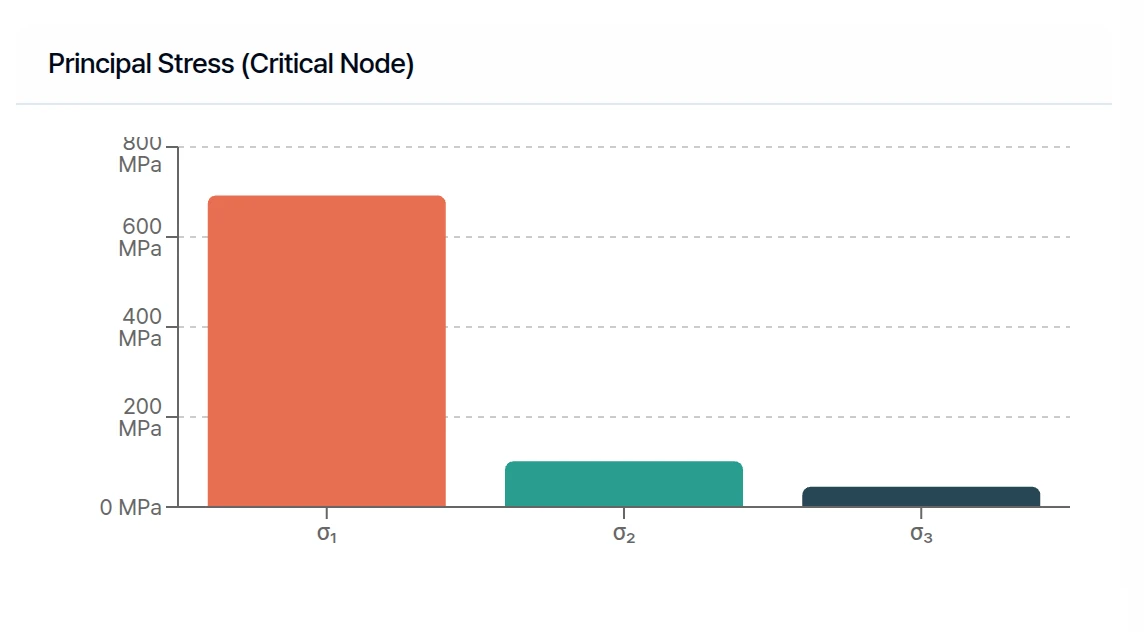
Principal stresses are the stresses along the three directions in which the material is purely pulled or pushed, with no shear. σ₁ is the largest and σ₃ the smallest.
Here σ₁ is by far the largest, and it is positive: the material is pulled mainly in one direction. That is the tension side of a lug bending at its root, where it meets the base.
Press Finish on this page to complete the tutorial. You now know how to set up materials, constraints and loads, and how to read a structural result.
Completion checklist
- The bracket is Titanium, with a yield strength of 1.40 × 10² MPa.
- The bottom of the base plate is fixed.
- The facial force is 100000 N along +Y on the lug face.
- Accuracy is 3 and the run shows Success.
- The stress, color map and report values have been reviewed together.
Need Assistance or Have Questions?
Frequently Asked Questions: FAQ Link
Support Inquiries: support@everysim.io